High On a Low Supply?
OCT angiography discriminates between POAG, NTG and normal patients
The first three papers describing OCT angiography (OCT-A) didn’t examine the vasculature of the eye with the technology, they examined blood flow in the outer layers of the brains of rats (1)(2)(3). It was actually the fourth that examined the human eye; in 2012, Jia et al. (4) compared optic nerve head (ONH) flow in patients with preperimetric glaucoma (PPG; n=4) with normal subjects (n=4), and found that ONH flow was significantly lower in the PPG group.
Today, OCT-based analysis of the peripapillary retinal nerve fiber layer (RNFL) thickness is a commonly performed method of detecting glaucoma and assessing its progression, but OCT-A is rapidly becoming an extremely useful method of diagnosing and staging glaucoma progression. When you perform OCT-A in normal eyes, you see a dense microvascular network around the optic disc – but this annular network is attenuated both globally and focally in patients with glaucoma, which results in reduced blood flow (5)(6). The question is now: can OCT-A be used to differentiate between different types of glaucoma?
To find out, Scripsema et al. (7) examined 92 subjects who had either no glaucoma, normal tension glaucoma (NTG) or primary open-angle glaucoma (POAG), and performed perimetry, assessed RNFL and used OCT-A to generate peripapillary density maps of each patient (Figure 1).
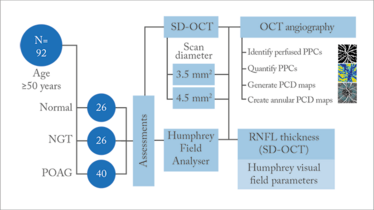
Figure 1. Study design and assessed parameters. NTG, normal-tension glaucoma; POAG, primary open-angle glaucoma; PPC, perfused peripapillary capillaries; PCD, perfused capillary density.
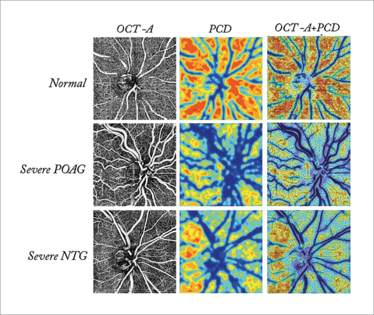
Figure 2. Perfused capillary density (PCD) maps: normal vs. primary open-angle glaucoma (POAG) vs. normal-tension glaucoma (NTG). Adapted from (1). Credit: Nicole Scripsema, Shelley Mo, Toco YP Chui, Richard Rosen. New York Eye and Ear Infirmary of Mount Sinai.
There were three key findings. The 4.5 mm² scans showed that annular perfused capillary density (PCD) in patients with POAG (34.24 ± 6.76 percent) and NTG (37.75 ± 3.52 percent) was significantly lower than in patients without glaucoma (42.99 ± 1.81 percent; p<0.01 and p<0.01, respectively). There was also a moderate correlation between annular PCD values and RNFL thickness. When the researchers used linear regression analysis to compare the annular PCD from the 4.5 mm² scans to the Humphrey Visual Field (HVF) mean deviation, HVF average deviation and RNFL thickness, respectively, they found that all comparisons showed statistical significance (P<0.05).
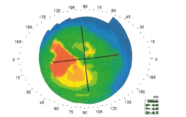
In terms of differentiating between types of glaucoma, however, the color-coded PCD maps were of greatest utility (Figure 2), showing that POAG and NTG patients had a reduction in perfused capillaries that progressed in size when comparing early, moderate, and severe glaucoma groups – or in other words, the areas lacking perfused capillaries become larger as glaucoma progresses. In POAG, the pattern of blood flow loss closely matched the optic nerve fiber loss, and in NTG, the pattern of blood flow loss – while not significantly different from open-angle glaucoma – tended to be more diffuse.
There are a number of reasons why this study represents a welcome advance. The identification of vascular factors that are indicative of NTG should help to detect the disease earlier, and in addition to enhancing our knowledge of glaucoma pathophysiology, OCT-A of perfused peripapillary capillaries around the ONH should also help with monitoring the disease’s progression, and also represents a new – and potentially very useful – biomarker for use in future clinical studies.
- VJ Srinivasan et al., “Rapid volumetric angiography of cortical microvasculature with optical coherence tomography”, Opt Lett, 35, 43–45 (2010). PMID: 20664667.
- VJ Srinivasan et al., “Optical coherence tomography for the quantitative study of cerebrovascular physiology”, J Cereb Blood Flow Metab, 31, 1339–1345 (2011). PMID: 21364599.
- VJ Srinivasan et al., “OCT methods for capillary velocimetry”, Biomed Opt Express, 3, 612–629 (2012). PMID: 22435106.
- Y Jia et al., “Quantitative OCT angiography of optic nerve head blood flow”, Biomed Opt Express, 3, 3127–3137 (2012). PMID: 23243564.
- L Liu et al., “Optical coherence tomography angiography of the peripapillary retina in glaucoma”, JAMA Ophthalmol. 133, 1045–1052 (2015). PMID: 26203793.
- Y Jia et al., “Optical coherence tomography angiography of optic disc perfusion in glaucoma”, Ophthalmology, 121, 1322–1332 (2014). PMID: 24629312.
- NK Scripsema et al., “Optical coherence tomography angiography analysis of perfused peripapillary capillaries in primary open-angle glaucoma and normal-tension glaucoma”, IOVS, 57, OCT611–OCT629 (2016). PMID: 27742922.
I spent seven years as a medical writer, writing primary and review manuscripts, congress presentations and marketing materials for numerous – and mostly German – pharmaceutical companies. Prior to my adventures in medical communications, I was a Wellcome Trust PhD student at the University of Edinburgh.


