Analysis Paralysis
Don’t be a victim of it. Clinical trial data can be complex and legion, but answering two questions may help you apply these results to the care of your patients.
At a Glance
- Keeping current with the latest in clinical trial literature can be challenging – but for many ophthalmologists, the important question is what the results mean for their patients
- Prior evidence, study design, and the level of statistical significance all inform the clinical relevance of a trial
- The answers to a short list of questions about the trial design and its results should be all that’s required to determine whether a result is likely to be reproduced in your practice and be clinically important to your patients
- You don’t have to be a stats guru to evaluate trial data – your knowledge of your patients, their diseases, and a critical approach when reading the literature will point you in the right direction
The sheer volume of ophthalmic clinical trials in the literature keeps rising (Figure 1). If we look at the last five years, on average 797 trials were published each year. Let’s put this in to context. Between 1980 and 1985, the mean number of clinical trials published each year was 94. If we restrict this analysis to a single subspecialty, like retina, it’s the same story: the mean number of clinical trial publications over both periods was 161 and 9, respectively. Clinical trials have become increasingly expensive to run over the years too, so their designs have evolved to be smarter, more efficient, and to examine more from the same patient group – and so the statistical methods used have evolved too (1). You could be forgiven for fearing “analysis paralysis”. So just how do we stay atop of the trial literature and apply this knowledge to our own practices and patients?
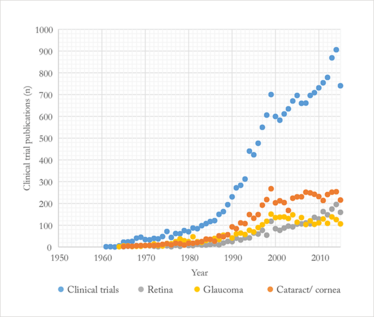
Figure 1. Number of PubMed-listed eye clinical trials (1950–2015), broken down by major specialty.
Unfortunately, the answer to this question isn’t straightforward – restrictive enrolment criteria, conflicts of interest, publication bias, biological variability and a number of limitations that are inherent in clinical trial design can all greatly complicate attempts to apply clinical trial results to the real world, and it can sometimes be rather difficult to unravel the actual import of a “statistically significant” result for the patients sitting in your office. For ophthalmologists confronted with dense and complex data, there are some simple methods that can be applied to more easily assess what (if any) meaning the data might have for their own patients.
The significance of “statistically significant” results
The term “statistically significant” can be misunderstood – not all statistically significant results are reproducible, and they are not necessarily clinically important! The level of statistical significance we’re dealing with is also central – in other words, p=0.03 is not the same thing as p=0.001, although both are statistically significant if their pre-specified type 1 error is 0.05. A type 1 error occurs if we reject a null hypothesis that is valid. The null hypothesis usually stipulates that there is no difference between the treatment and the control groups. So if we reject the null hypothesis, it means we think there is a real difference between the treatment and control groups. If we reject the null hypothesis incorrectly, we’ve incorrectly concluded that any differences in outcome between the treatment and control groups reflect a true difference between them. (Technically, if we reject the null hypothesis, we have concluded that if we repeated the trial many times we would see a difference between the treatment and control groups of this magnitude or greater less than five percent of the time assuming: 1. the null hypothesis is valid, 2. that the statistical model of the expected distribution of outcomes is valid, 3. that the p-value is <0.05, and 4. α=0.05.) That’s why we say that a type 1 error refers to a “false positive” conclusion. The p-value refers to the probability of observing a given outcome under the condition posited by the null hypothesis and given the statistical model we’ve used to predict the distribution of outcomes under the null hypothesis. If the p-value is very, very small, it implies that, given the statistical model we’ve used, the likelihood of achieving the outcomes we observed (or a more extreme outcome) is very, very low given the null hypothesis. That’s why we usually think it’s acceptable to reject the null hypothesis as valid if the p-value is very small. The p-value doesn’t tell us if the null hypothesis is valid though.
Reproducible vs. replicable
Sometimes the terms reproduce and replicate are used interchangeably, but in statistics they don’t mean the same thing. Reproducibility of a result means that a result will recur even if the experimental conditions vary to some degree from one experiment to another. Reproducibility is what we seek when applying the results of a clinical trial to our clinical practice. Generally speaking, increasing the number of individual measurements (e.g., number of patients enrolled) increases the power of an experiment and the likelihood of a reproducible result. Replicability of a result means that if we repeat an experiment under identical conditions to the first trial, we will obtain identical results. Replicability in clinical trials is virtually impossible. Consider, for example, two parallel studies in which patients with diabetic macular edema are being treated with a new drug. Each trial has a treatment and a control group. Unless trial A has exactly the same patients as trial B, we should not expect trial A to give exactly the same result as trial B, even if the enrolment criteria, for example are identical. Intuitively, we can understand that replicability is going to be inversely proportional to the number of experimental variables, including the stochastic nature of biological processes. It may be surprising to know that statistical analysis of clinical trial results using frequentist methods (i.e., the inference framework on which statistical hypothesis testing and confidence intervals [CI] are based) generally assumes that replicability of a trial result is possible!
Poor reproducibility of results is a very important problem not only in clinical science, but also in basic research. One study reported that more than one in six highly-cited original clinical research studies claiming an effective intervention were contradicted by subsequent studies (2). The most obvious way to reduce the risks associated with generalizing the results of a single study is to reproduce the results – which is why the FDA generally expects at least two adequate well-controlled studies to register a new drug.
Unfortunately, as clinicians, we don’t usually have the opportunity to reproduce clinical studies. So to determine whether a study’s results are likely to be reproducible in our practice, we have to make educated guesses. We can ask ourselves five questions that might help guide our estimation (see box, “The Five Question Test”). The rationale behind this approach is that the likelihood of a single research finding being correct depends on the prior evidence, the trial design, and the level of statistical significance.
If the answer to all five questions is yes, then the result is likely to be reproduced in your practice. If the answer is yes to all questions except number five, then the reproducibility is unclear, and, it is hypothesized (3) that the reproducibility depends on the strength of the prior evidence. For example if the prior evidence is multiple, pivotal, randomized clinical trials (that is, very strong evidence) and if the current trial result differs from those previous results, then the likelihood of reproducibility may not be very high. If the prior evidence is weak (for example, a small case series) and if the answer to the first four questions is yes, then the likelihood that the results of the recent study will be reproduced in your practice is stronger.
The Five Question Test
Is the study result likely to be reproduced in your clinical practice?
1. Has bias in the study been minimized?
This is usually best controlled by concealed treatment allocation, double masking, and a good study design.
2. Is the result likely due to the treatment?
Randomized treatment assignment is almost always the best way to eliminate the influence of confounding variables.
3. Is the result unlikely to have been caused by chance?
If the study only has a small number of patients enrolled, the investigators may not be able to reliably estimate the magnitude of the treatment effect. Is the tested hypothesis pre-specified or post hoc? Post hoc is less reliable. Is the p-value much less than the pre-specified type 1 (false positive) error? If it is, we can reject the null hypothesis with greater confidence.
4. Is the study population representative of your patients?
If not, the results may not be applicable.
5. Is the result consistent with prior evidence?
This could include findings from relevant, previously published studies and also your own experience from extensive clinical practice.
Case study: VIEW
The VIEW (VEGF Trap-Eye: Investigation of Efficacy and Safety in Wet AMD) trials (4) provide a good illustration of the problem of replicating study results – the VIEW 1 trial found that 2 mg of aflibercept every four weeks gave a 2.8 letter better visual outcome than 0.5 mg ranibizumab – which is a statistically significant result. But in the parallel VIEW 2 study, the direction of the benefit was reversed (although not statistically significantly), so even if all the conditions are equal for two studies, there’s always a chance that random or biological variables will cause the results to differ – despite similar demographics and disease parameters.
Case study: DRVS
We can apply the five question test to the Diabetic Retinopathy Vitrectomy Study (DRVS). DRVS showed that after two years of follow-up, early vitrectomy for severe nonclearing vitreous hemorrhage was better than deferred surgery for patients with type 1 diabetes but not for patients with type 2 diabetes (5). The DRVS was a randomized, prospective, multicenter trial and tested a large number of patients that are typically found in clinical practice, but the result it produced was not consistent with the totality of evidence. Evidence from clinical practice strongly suggested that the complication – such as the DRVS 20 percent no light perception rate – was much lower in practice than what was observed in the study (possibly due to the introduction of intraoperative laser photocoagulation during the time the study was conducted). As a result, many surgeons chose not to defer surgery for type 2 diabetic patients with nonclearing vitreous hemorrhage based on the results of the DRVS because they recognized that the study results simply didn’t reflect what they were seeing in their own patients. Extensive clinical experience in itself can function as an evidence base when deciding whether the latest study results are relevant to your patients.
It’s statistically significant, but is it clinically important?
The degree of statistical significance (e.g., p<0.00001) doesn’t imply that the magnitude of the difference between the treatment and control groups is large. It just implies that a difference between the two groups, however large or small, is likely to be observed consistently if we repeat the trial many times. As clinicians, though, we recognize that even if the difference between the treatment and control groups is reproducible, if the treatment gives most patients only a minor degree of improvement (e.g., a 1 ETDRS letter gain in vision from baseline), the trial result may not be clinically important.
The issue of clinical importance is well illustrated by the Comparison of AMD Treatments Trials (CATT) trial. When monthly and pro re nata (PRN) treatment of choroidal neovascularization were compared, at year 2 there was a mean 2.4 letter better visual outcome in the monthly injection cohort versus the PRN treatment cohort, with p=0.046 and a 95% CI of 0.1–4.8 letters (6). This difference is statistically significant, but is it clinically important?
Batterham and Hopkins (7) have proposed a way we can approach this question that avoids complicated mathematics (Figure 2). It’s a two-step approach. First, decide beforehand what a clinically meaningful difference between the treatment and control groups would be. This decision requires sophisticated knowledge of the disease and of the patients we’re going to treat (and unfortunately, there’s not always a clear answer). But for the sake of argument, let’s say that a 4 ETDRS-letter gain or loss in vision is the smallest difference in visual outcome that we will consider clinically important. This choice defines regions of beneficial (4 letter gain), harmful (4 letter loss), and trivial (loss or gain of less than 4 letters) outcomes. Next, focus on the CIs. Determine whether the 95% CI mostly includes the range of clinically beneficial outcomes, but lies outside the range of harmful outcomes. If these conditions are met, the result is probably clinically important, but it may or may not be statistically significant. Combine the CIs and the regions of benefit and harm to make a decision about what you would consider clinically important.
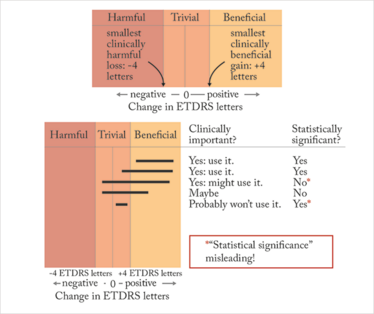
Figure 2. The Batterham and Hopkins approach: decide what’s harmful, beneficial or trivial, (≥4 letter loss, ≥4 letter gain, or anything in-between), examine the confidence intervals (black lines) and determine its clinical importance to your practice.
To these two steps, we should add a third: assess the proportion of eyes with clinically meaningful changes in vision (8). Why is this step important? Suppose the mean gain in vision for treatment A is 4 ETDRS letters, which we decide is the minimum improvement that is clinically meaningful, and the mean gain in vision for treatment B is 0 ETDRS letters. If we advise treatment A, an astute patient will point out that half the patients assigned to this treatment achieved less than a 4 letter gain! If we advise against treatment B, an equally astute patient will point out that half the patients receiving B achieved more than a 0 letter gain. (In both cases, we assume the treatment outcomes are normally distributed). Both patients want to know what proportion of patients assigned to treatment A or B achieved a clinically important degree of visual improvement. Although 4 letters might be the minimum amount of improvement we would term significant, patients might not be so impressed and very likely would insist that from the standpoint of improving activities of daily living, more improvement is needed. A standard metric for clinically important visual improvement in this regard is 15 ETDRS letters or more improvement (“moderate or greater visual improvement”) (8).
Looking at the CATT trial, and using our 4 letter difference as the minimum important difference between two treatments, then the 95% CI lies mostly within the trivial range, and we might conclude that this result is statistically significant, but probably not clinically important. Moreover, the percentage of patients achieving 15 or more letters visual improvement from baseline was 32 percent with monthly injections vs. 30 percent with PRN injections. So, the visual benefit of monthly vs. PRN injections is marginal. In other words, it’s statistically significant but probably not clinically important.
Standing up to stats
Replicating the results of a clinical trial is often difficult or impossible – even with the resources available to large drug and medical device manufacturers. Moreover, not all statistically significant results are even reproduced. So it’s no surprise that in clinical practice, it is not easy to know what the outcomes of a trial could mean for your own patients, both with regard to reproducing the results in your practice and knowing whether those results would be clinically important for your patients. But knowledge of the latest literature, combined with good clinical judgment and some statistical understanding, allows us to approach new study results with a critical eye.
Marco Zarbin is a Vice Chair of the Scientific Advisory Board of the Foundation Fighting Blindness, Editor-in-Chief of Translational Vision Science and Technology, and an ex-officio member of the National Advisory Eye Council. He is also a member of the American Ophthalmological Society, Academia Ophthalmologica Internationalis, the Retina Society, the Macula Society, the Gonin Society, and the ASRS.
- SN Goodman, “Statistics. Aligning statistical and scientific reasoning”, Science, 352, 1180–1181 (2016). PMID: 27257246.
- JP Ionnidis, “Contradicted and initially stronger effects in highly cited clinical research”, JAMA, 294, 218–228 (2005). PMID: 16014596.
- MA Zarbin, “Challenges in applying the results of clinical trials to clinical practice”, JAMA Ophthalmol, 134, 928–933 (2016). PMID: 27228338.
- JS Heier et al., “Intravitreal aflibercept (VEGF trap-eye) in wet age-related macular degeneration”, Ophthalmology, 119, 2537–2548 (2012). PMID: 23084240.
- The Diabetic Retinopathy Vitrectomy Study Research Group, “Early vitrectomy for severe proliferative diabetic retinopathy in eyes withuseful vision. Clinical application of results of a randomized trial – Diabetic Retinopathy Vitrectomy Study Report 4”, Ophthalmology,95, 1321–1334 (1988). PMID: 2465518.
- DF Martin et al., “Ranibizumab and bevacizumab for treatment of neovascular age-related macular degeneration: two-year results”, Ophthalmology, 119, 1388–1398 (2012). PMID: 22555112.
- AM Batterham, WG Hopkins, “Making meaningful inferences about magnitudes”, Int JSports Physiol Perform, 1, 50–57, (2006). PMID: 19114737.
- RW Beck et al, “Visual acuity as an outcome measure in clinical trials of retinal diseases”, Ophthalmology, 114, 1804–1809 (2007). PMID: 17908590.
Marco Zarbin is a Vice Chair of the Scientific Advisory Board of the Foundation Fighting Blindness, Editor-in-Chief of Translational Vision Science and Technology, and an ex-officio member of the National Advisory Eye Council. He is also a member of the American Ophthalmological Society, Academia Ophthalmologica Internationalis, the Retina Society, the Macula Society, the Gonin Society, and the ASRS.
I have an extensive academic background in the life sciences, having studied forensic biology and human medical genetics in my time at Strathclyde and Glasgow Universities. My research, data presentation and bioinformatics skills plus my ‘wet lab’ experience have been a superb grounding for my role as a deputy editor at Texere Publishing. The job allows me to utilize my hard-learned academic skills and experience in my current position within an exciting and contemporary publishing company.


