You have all heard of MIGS, but have you heard of MEGS? It’s a term that was coined, half-jokingly, by the avant-garde of these new surgical approaches, including my mentor, Robert Weinreb. Their point was this: although MIGS approaches were considered to be “minimally invasive,” they were in fact minimally effective! But many a truth is told in jest: the efficacy of MIGS approaches can be highly variable. You put a device in the trabecular meshwork with the assumption that aqueous humor outflow (AHO) is the same in all patients, and that when you place that little stent in Schlemm’s canal, there’s going to be sufficient distal outflow to lower the intraocular pressure (IOP). But this is simply not always the case. These devices might be all the rage in glaucoma at the moment (because of their ease and safety), but we all know they don’t always work as well as they should – and my colleagues and I believe that we can show you why.
Back to basics
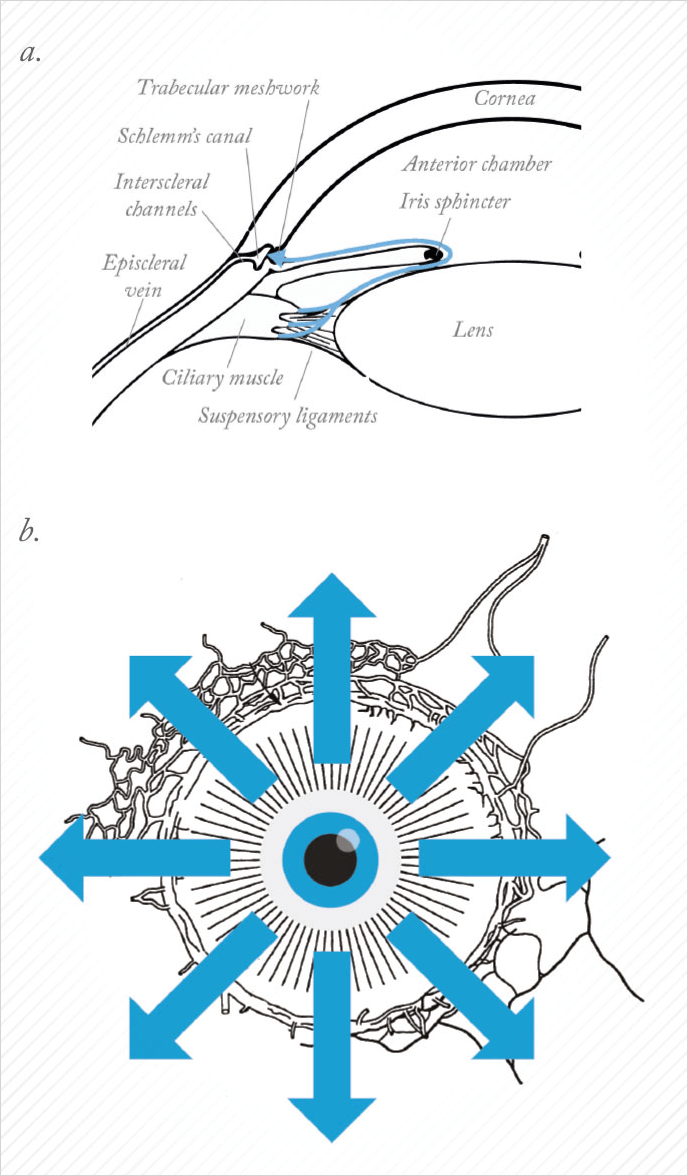
When we teach medical students about AHO, we start with a two-dimensional picture, with aqueous humor production at the ciliary processes, followed by aqueous outflow through the outflow pathways (see Figure 1a). But if you take this two-dimensional image, rotate around 360°, and you look at the eye externally from the front (Figure 1b), you will get the impression that outflow is 360° uniform, circumferential away from the limbus. But there is evidence that instead, outflow may be segmental in nature; basically, some areas have good outflow, whereas others do not. It may be segmentally different, say between you and me, or between your left eye and your right eye (Figure 2). There may also be disease relevance here, where the ocular hypertensive component of glaucoma may be associated with the loss of functional segmental outflow units. As alluded to before, there may also be treatment relevance with MIGS. We almost universally take a temporal clear corneal approach and place the device nasal. So the inconsistent results you read about in the literature – sometimes it works, sometimes it doesn’t – may have to do with whether or not we are accessing the correct outflow locations. If you want to perform a surgical procedure to lower IOP, you want to understand the patient’s unique outflow anatomy and physiology and take the right MIGS approach in the optimal location. So imagine if you could see exactly where aqueous humor was flowing?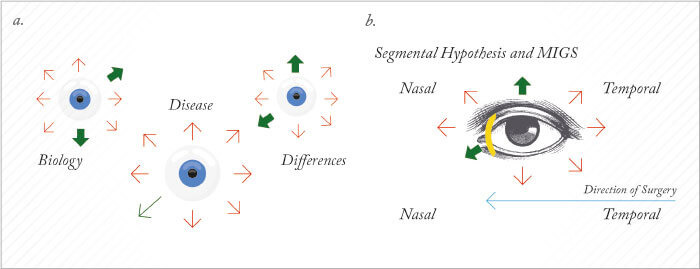
What would it take?
Let’s pause to ask a question: what things do we need for a clinical imaging technique to be successful? First of all, it’s got to be live – after all, we’re dealing with live people. You can experimentally trace outflow pathways with the introduction of labeled beads into the anterior chamber of the eye and see segmental localization in the trabecular meshwork, it’s just that you have to perform histology afterwards to obtain that data. This is of less use in a clinical setting. Second of all, we need to get the information back in real-time, just like the camera app display on your iPhone. If it isn’t in real-time, it isn’t convenient, and has no hope of being used peri- or intraoperatively. Third, it has to be comprehensive in both a linear and a circumferential sense. Linear, in that that the entirety of the outflow pathways are included – absolutely nothing is excluded; circumferential means we get potential information 360° around the limbus simultaneously. Lastly, it has to be physiologic: we have to do everything at physiological IOP. These patients have glaucoma, after all. We can currently perform real-time AHO imaging in enucleated eyes, using 2.5% fluorescein as a tracer molecule and visualizing its distribution in real-time using SD-OCT (Spectralis OCT2, Heidelberg Engineering). We call this aqueous angiography, and it’s the fruit of a collaboration between UCLA and UCSD.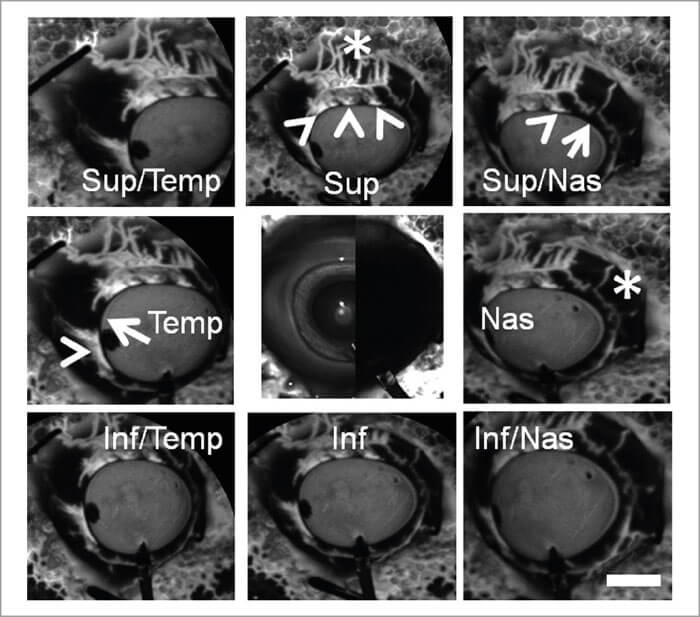
What does aqueous angiography look like?
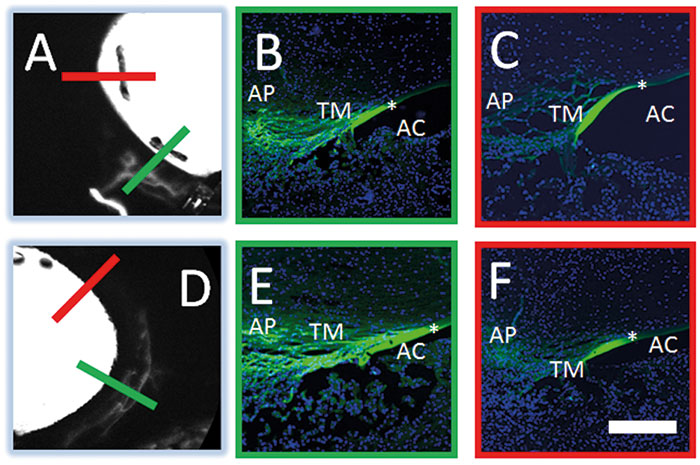
Figure 3 shows aqueous angiography in model enucleated pig eyes. The middle column shows composite images: the images to the left are pre-injection scanning laser ophthalmoscopy (SLO), and to the right, the pre-injection fluorescein background. We have a Lewicky anterior chamber maintainer coming in at six o’clock in both cases, and we deliver the 2.5% fluorescein at physiologic pressures. Why 2.5%? Because that concentration of fluorescein has been described as a capsular dye (albeit a bad one). At various positions within the angiographic function, the arrowheads point out perilimbal segmental regions of angiographic signal outflow; the arrows denote perilimbal segmental regions without, and the asterisks are more distal. Now, you might argue that this is just fluorescein staining of the surface of the conjunctiva, but as we’re using the Spectralis, we can perform concurrent anterior segment OCT to prove otherwise. Still not convinced? I can do a different experiment, using fixable fluorescent dextrans (FFDs). FFDs are an extremely useful imaging technique: the dextran tracer can be conjugated to surrounding biomolecules by aldehyde-mediated fixation, meaning it can be detected with subsequent immunohistochemical and ultrastructural imaging techniques. So what Figure 5 shows is that in angiographically positive regions (the green lines), we see trapping of the dextran – and therefore labeling of the outflow pathways – in panels b and e, but not in angiographically negative regions as in the red lines as illustrated in panels c and f. In pig eyes (Figure 4), in angiographically positive (but not negative regions), we see intrascleral lumens, reminiscent of outflow pathways.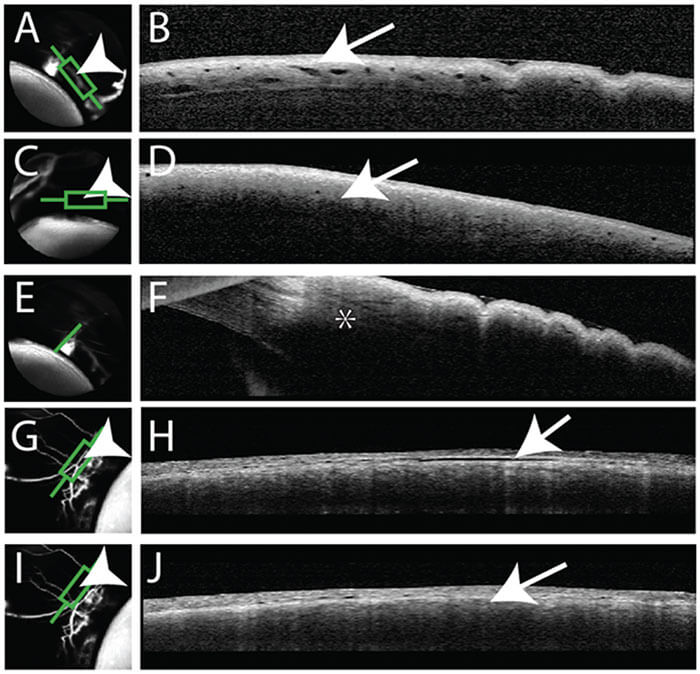
Exploring the potential
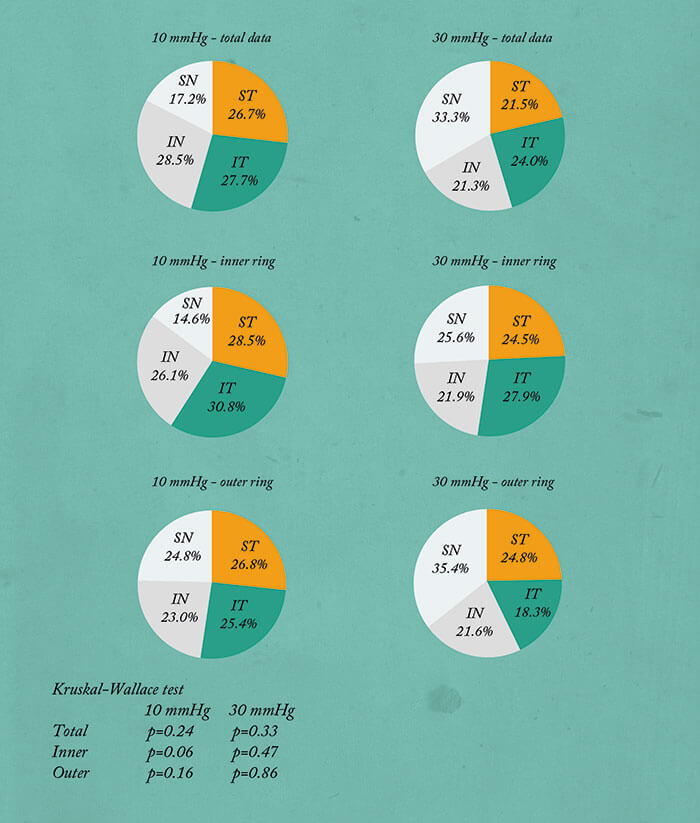
The most wonderful thing about having a real-time imaging method that works, is that we can start making observations, and start asking questions. We took 36 eyes, evenly divided 10:30 mmHg, right eye, left eye, and performed aqueous angiography – and saw all sorts of patterns. To look at this quantitatively, we would make angiographic rings of data by removing anything within the anterior chamber and beyond the globe horizon. With time, the angiographic intensity increases then starts to plateau. Now this isn’t entirely unsurprising, because these eyes are enucleated – their episcleral veins are cut and there’s nowhere for the fluorescein to go. This meant that when we performed statistical analyses, we chose early time points. In any event, having these rings enabled us to divide them into quadrants, and also to divide them into inner rings and outer rings. So for these 36 eyes, we were able to stratify the quadrants by relative signal intensity, irrespective of the locational identity, and you could see that in all the conditions, the numbers are quite heterogeneous, implying segmental flow. We performed a Kruskal-Wallis test, because this is an ANOVA variant for small sample sizes that looks for an overall mean difference among the groups. And in every condition, there was a statistically significant mean difference found, thereby demonstrating segmental outflow (Figure 6). You can also stratify the quadrants by location: superior temporal, superior nasal, and now you see that the numbers are more homogeneous and there was no case where overall statistical significance (found by Kruskal-Wallis testing) was achieved, implying that here, there was no single automatic best or worst quadrant (Figure 7).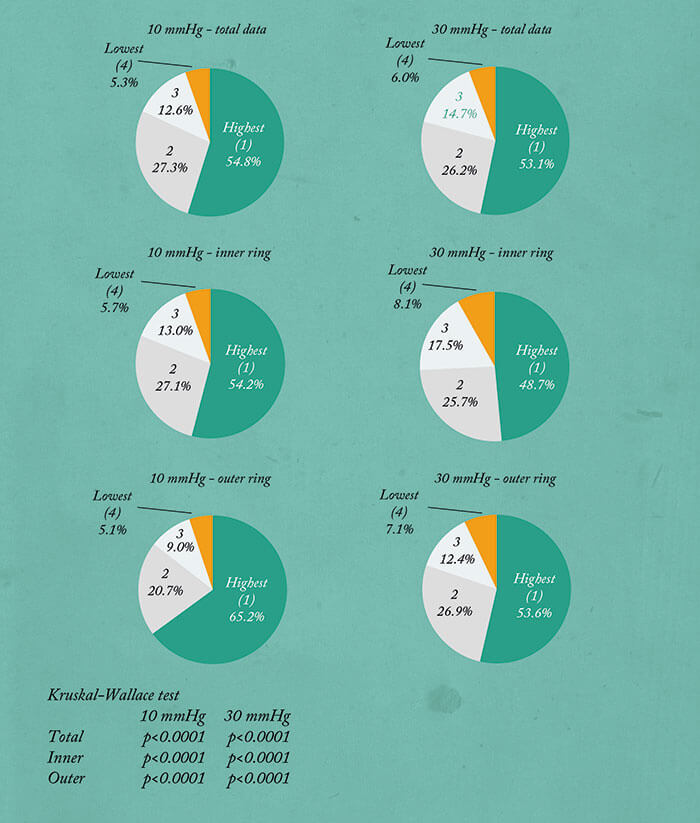
Aqueous angiography in humans
We can also perform aqueous angiography in enucleated human eyes. Figure 8 shows a pair of eyes from 79 and 83 year old females – both died of cardiac issues. So you can see that with these two women the patterns are different; between the women, and between the two eyes of each individual woman. For instance, take a look at panels e and f on Figure 8 (the 83-year-old female). At first glance, it might appear that the angiographic signal is all on the left, but remember this is her right eye and left eye, so in one case it’s nasal and in the other case it’s temporal. So at this point with aqueous angiography, what we have is a method that ticks all of the boxes of an ideal imaging modality – apart from one; it isn’t yet live – but that’s about to change. We’re working on that in live animal studies, and will do so in live humans (we have an IRB). It’s going be fascinating. Hopefully when recapitulated in live individuals or animals, we’ll continue to see segmental patterns. But in any event, we will almost certainly gain a better understanding of AHO – and study the differences in anatomy between regions of greater outflow and lesser outflow, and try to understand the reasons why.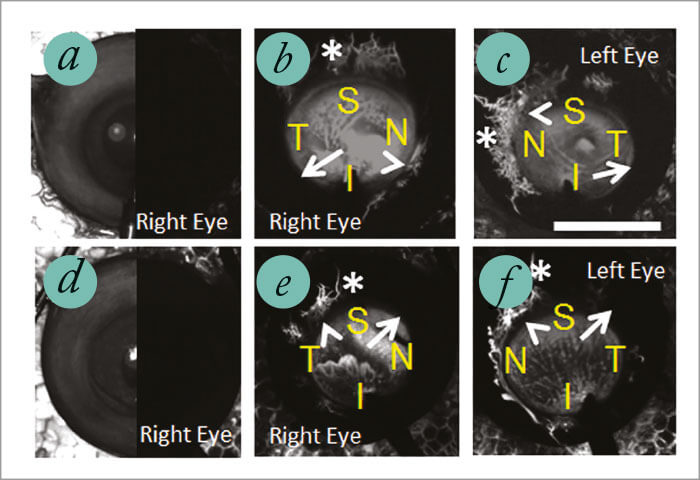
What this means for the future of glaucoma treatment
The clinical implications are clear: if aqueous angiography works in clinical practice, it gives us a means to improve glaucoma surgery outcomes through customizing our strategy to the patients’ outflow anatomy. Experiments are already underway in model eyes, in order to assess where trabecular bypass surgeries are best conducted. As aqueous angiography is performed on an increasing number of people, we’ll begin to see if there are differences in outflow between people with and without glaucoma, and how various treatments can help them. Consider this. Today, this technique is at a preclinical stage. But if you think about cataract surgery a few decades ago, all we had was axial length and refractive correction – and we selected intraocular lenses based only on that. Today, pre-cataract surgery ocular biometry has become far more refined, and the hope is that technology like aqueous angiography will mean that glaucoma surgery will become very much like cataract surgery: each individual patient will have their outflow pathways mapped and the surgeon will select the right device and location based on the patient’s own outflow anatomy to safely maximize effectiveness and IOP reduction. Imagine that!
References
- S Saraswathy et al.,“Aqueous angiography: real-time and physiologic aqueous humor outflow imaging”, PLoS One, 11, e0147176 (2016). PMID: 26807586.