
- Electrophysiological testing, such as visually evoked potentials (VEP) and electroretinography (ERG), provide an objective analysis of the functionality of the neuro-visual pathway
- Fast, targeted testing, and easily interpretable results now make it feasible to conduct these tests in the clinic • Along with clinical examinations, electrophysiological testing can aid diagnosis of visual disease and help direct treatment plans
- Electrophysiological testing can also provide insight on the efficacy of therapy
Ophthalmologists have a whole battery of tests available to them to help diagnose vision disorders – both structural and functional (1). Corneal topography, slit lamp examinations, fundus photography, and optical coherence tomography (OCT) all provide images of the structures of the eye. Examinations like Snellen visual acuity (VA), perimetry and Amsler grids all help us build up a picture of how well our patients’ eyes function. Sometimes, relating the two is easy – a cataract reduces VA as measured by Snellen, or the macular degeneration that manifests first in a distorted Amsler grid is detected by OCT. However, there are a number of circumstances where relating the functional problem with a structural issue is hard or almost impossible.
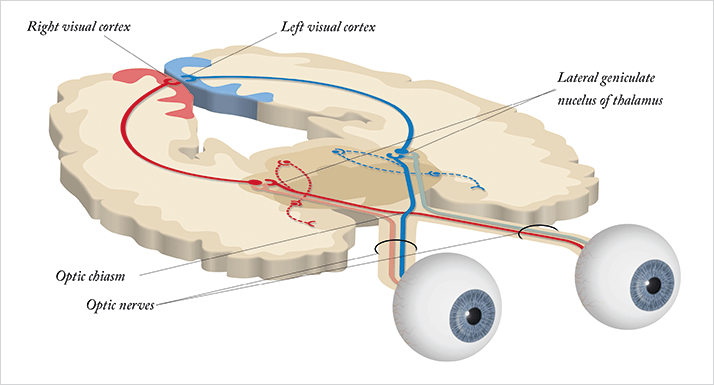
Of course, vision involves the brain as well as the eye. Light hits the retina. Photoreceptors perform their function and generate action potentials – electrical signals – that are passed through bipolar cells on to the retinal ganglion cells (RGCs), whose axons bundle together forming the optic nerve, passing that information onto the brain (see Figure 1). From there, most of that information is carried to the lateral geniculate nucleus (LGN) in the thalamus – in the opposite side of the skull, which means that both optic nerves cross over at a single point – the optic chiasm, situated at the base of the hypothalamus. The LGN performs some processing of the information received, but its principal function is as a sensory relay; its neurons pass the sensory information onwards to the visual cortex – the region responsible for the vast majority of processing and interpretation of the visual input received. Electrophysiological tests allow us to assess the functional integrity of this neuro-visual pathway; however, the technique has traditionally been the reserve of research facilities, as the necessary instruments have historically been expensive, bulky and fragile. But there’s a common trend with technology: devices get cheaper, smaller and easier to operate with each new generation.
Testing the neuro-visual pathway
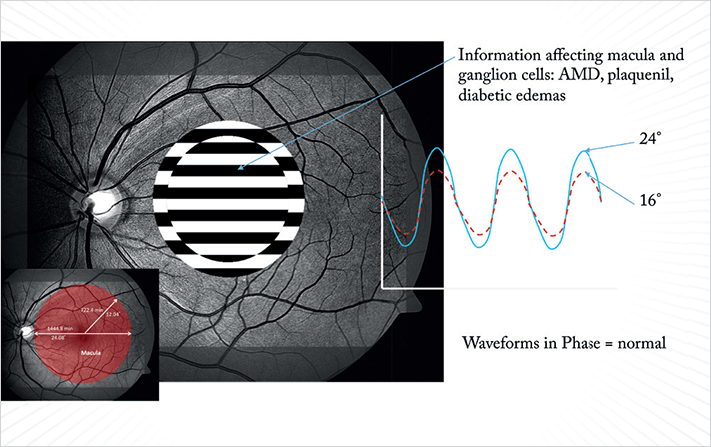
Visually evoked potential (VEP) testing involves patterned, flashing lights (stimuli) that elicit patterned depolarization of photoreceptors in the retina; the resulting electrical activity is measured at the visual cortex, thereby providing an objective measure of the function of the entire neurophysiologic system. VEPs can be measured directly with electrodes placed into the brain, but helpfully can also be measured externally with the placement of electrodes on the patient’s head over the region of the visual cortex. It’s not a new technique by any means – its first use was documented in the 1930s, and it has been used for many years for both the diagnosis and assessment of multiple sclerosis. The patient’s VEP response is evaluated for amplitude and latency – the amplitude, measured in microvolts (µv, see Box 1), indicates the amount of electrical energy that reaches the visual cortex, and this can vary depending on the number of healthy retinal cells that are stimulated, and the visual system’s ability to discriminate between differently sized objects. The general principle is: the more difficulty a patient has seeing the stimulus, the smaller the electrical response evoked and therefore, the smaller the amplitude measured (Box 2).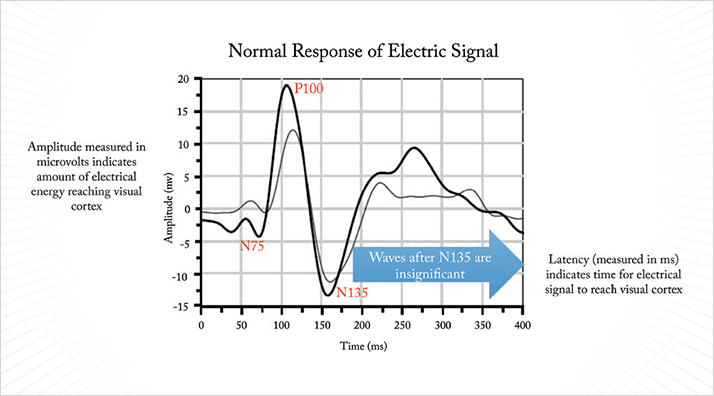
Latency, measured in milliseconds (ms), indicates the amount of time the electrical signal takes to travel from the retina to the visual cortex, and should exhibit minimal variability between subjects. Latency can increase in cases of optic neuritis or multiple sclerosis, as their pathology can include demyelination of the optic nerve sheath. Electroretinography (ERG) is performed in a similar manner to VEP. Electrodes, until recently, were typically rested on the eye, and standardized patterns of light are displayed on a screen in front of the patient. As with VEP, amplitude and latency are measured in µv and ms, respectively, but what ERG tells a different story. The ERG represents the combined output of the action potentials produced by many of the electrically active cell types within the retina. By varying the stimulus conditions (say, flash or pattern stimulus, the presence or absence of a background light, or the colors shown), you can elicit a stronger response from some cell types than others.
For example, giving a dim flash visual stimulus on a dark-adapted eye will generate a response that’s primarily from the rod photoreceptor system. If you perform a flash ERG on a light-adapted eye, the principal response comes from the cone system. A succession of sufficiently bright flashes will elicit ERGs containing an a-wave (the initial negative deflection) followed by a b-wave (a positive deflection). The photoreceptors produce the leading edge of the a-wave and the remainder of the wave is produced by a mixture of cells including photoreceptors, bipolar, amacrine, and Müller cells or Müller glia. The pattern ERG (PERG – see Boxes 3–5), evoked by an alternating checkerboard stimulus is used to detect the amplitude and latency of the electrical signal as it passes through the RGCs. In practice, this means that you can use a series of ERG tests to dissect out which cell types are causing vision dysfunction. If a patient presents with an abnormal VEP, PERG can be used to differentiate where the abnormality arises – retinal or optic nerve dysfunction. PERG can be particularly helpful for the detection of early-stage-glaucoma changes, before the onset of visual field defects. If a patient exhibits a decreased PERG amplitude, it indicates that one of the cell types damaged in glaucoma – RGCs – are present, but not healthy. Therefore, electrophysiological tests not only provide information on where certain defects lie within in the neuro-visual pathway, but also what retinal cell types are dysfunctional. Such information offers a useful, totally objective addition to the ophthalmologist’s diagnostic armamentarium, helping to clarify results from other tests and assessments performed.
Big steps from research to the clinic
The value of VEP and ERG testing in ophthalmology has long been acknowledged, but their use has typically been restricted to academic research institutions, as they weren’t simple to perform. In the past, sensors had to be sterilized and then carefully placed directly on the eye so as not to injure the patient. The sensor was irritating, something that the patient had to tolerate for 45 to 50 minutes. After the test, specialized neuro-physicists needed considerable amounts of time to decipher the resulting waveforms of electrical brain activity. Although the resulting information was useful, it was hardly a test that could be integrated into the daily routine of a busy practice…All of that has changed. Increasingly, clinical examinations of patients presenting to eyecare professionals are undergoing ERG and having their VEPs assessed. Why? Because much like computer technology (calculations that took days for a punch-card fed mainframe the size of a building to perform can now be performed on your smartphone, smartwatch, or even a US$25 Raspberry Pi almost instantly!) – a similar transformation has occurred with VEP and ERG testing. The first step in bringing electrophysiological testing to the clinic was the development of external sensors that could replace those applied directly to the eye but still obtain the data required. The electrodes applied to the eye capture very small electrical signals – ranging from just 1.0 µv to 20 µv. External electrodes measure more than 100 µv and pick up more neural noise, which is a problem. Signal processing provides the solution. The background noise is usually random, so computerized signal averaging can be used to remove the noise and leave the signal. By synchronizing the data acquisition to the timing of the visual stimuli, you ensure that you isolate and process the right signal.
To give you an example of what’s available now, I use a NOVA system (Diopsys, Pine Brook, NJ, USA) that uses disposable sensors that are placed on the forehead for VEP testing and under the eye for ERG testing – both continuously collect electrical circuit information. Clearly, these are far more comfortable for the patient than electrodes placed on the eye, and the benefits in terms of patient compliance are obvious. But do they work as well as their predecessors? Extensive validation tests say so; data collected via these external sensors is highly repeatable, and has a very small standard deviation between subjects. The sensors present no risk of injury, require no sterilization or disinfecting, and the results tend to be more reproducible because they cause patients less irritation than electrodes placed in direct contact with their eye.
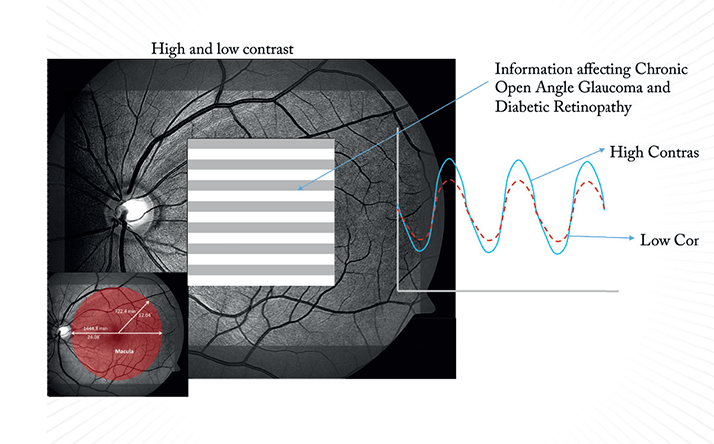
Better technology is one thing, but we also need VEP and ERG protocols that are directly applicable to the everyday clinic – the second step. Here we can build protocols from empirical data generated over 30 years of testing. For example, the earliest manifestation of glaucoma – in terms of function – is a decline in low-contrast sensitivity, which is primarily a function of the neuro-visual pathway. If you suspect a patient has degraded visual function that’s consistent with early glaucomatous damage, you can now run a validated PERG protocol in minutes that can detect that issue, helping you to confirm the diagnosis. In this case, the International Society for Clinical Electrophysiology of Vision determined that the optimal PERG protocol for this task is a pattern reversal stimulus, which is the preferred means of measuring a patient’s ability to detect the edges between black and white squares (1). The black and white checkerboard pattern size can be adjusted, the data suggests that the most effective is a 64 × 64 or 32 × 32 grid, as there are enough borders to elicit a response, while not being so small that patients with poor visual acuity have problems seeing the individual squares.
The final big step is the ability to rapidly analyze the data that comes from VEP and PERG testing and present it in a straightforward way, so that the physician can quickly and easily interpret the results. No longer do you need to wait days for neuro-physicists to interpret and plot the data – the device will do this for you, automatically.
Clinical applications
Despite being most often characterized by ocular hypertension and gradual vision loss, glaucoma is best described as a neurodegenerative disease that involves the death of the neurons and axons of RGCs (2). Although we routinely use IOP to determine the severity of the disease and as a marker of nerve damage, the two aren’t always analogous. Many patients with glaucoma have unexplained visual defects or outlying scores on visual field examination that can leave a physician with doubts over a diagnosis. However, (as part of a comprehensive clinical examination) VEP and PERG testing can provide additional information that can help refine a diagnosis and better direct treatment plans. Here, I offer some examples.Case Study 1 A 46-year-old male is currently taking Combigan (Allergan, Irvine, CA, USA), has IOP in the range of 13.0–14.0 mmHg and Snellen VA of 20/25. Heidelberg Retinal Tomography (HRT; Heidelberg Engineering, Heidelberg, Germany) images show some optic disc cupping, creating clinical suspicion for a need to further reduce IOP. The patient’s visual field test results show many false negative responses, decreasing the treating physician’s confidence in the results. We performed a VEP on this patient for an objective measure of visual function, and the results showed that the amplitudes in both low-and high-contrast and latency tests were within normal limits. We were then able to assume that this patient has an intact pathway from the optic nerve to the cortex. In spite of the patient’s inconsistent visual field testing, I felt confident that we could follow him without initiating any additional IOP-lowering therapies at this time. We scheduled him to come back in a year for follow-up testing.
Case Study 2 A 75-year-old female was suspected to have glaucoma. Her VA was 20/40 in one eye and 20/20 in the other, with IOPs of 17.1 and 21.3 mmHg as measured by the Pascal tonometer (Ziemer Group AG, Port, Switzerland). Fundus imaging showed temporal disc pallor and a slightly enlarged cup in the right eye; the left eye appeared healthy and her visual field test was suggestive of a defect in the superior-nasal quadrant. We performed a Diopsys NOVA VEP and PERG tests to assess the impact of cupping on the optic nerve. The VEP results demonstrated that the nerve was healthy, with good functionality from the optic nerve back to the cortex. However, the PERG testing failed to produce a good waveform. The amplitude was robust (so the patient has a good number of RGCs present), but the latency of the PERG suggested that the RGCs were not functioning properly, which may explain the visual field loss. The borderline morphology merited close follow-up, but we elected not to prescribe additional treatment at this time. IOP at subsequent visits remained in the low teens and we resolved to repeat the tests and follow this patient over time.
Case Study 3 A 64-year-old female presented with VA of 20/20 and 20/25, but complained of blurred vision and vision loss. Her IOPs were 16 mmHg and 19 mmHg. The patient was not able to complete a Humphrey field test, so we tested her with frequency doubling technology perimetry (FDT). The FDT can generally pick up earlier field changes; however, she did not do well on this test either. Her optic nerves looked quite healthy with imaging modalities, so we performed VEP. This too showed completely normal amplitude and latency. I chose not to perform PERG on this patient, as it is my suspicion that she is a poor test taker, and does not have glaucoma nor does she need treatment.
Case Study 4 A 59-year-old female presented with multiple complaints regarding eye spasms, triple vision and headaches. She had a history of ocular hypertension and substantial head trauma. Her IOP was 24 mmHg in her left eye and 29 mmHg in her right eye, and her VA was 20/25 and 20/20 respectively. HRT imaging showed optic nerves that appeared healthy, and her visual field tests were normal. Nevertheless, she still complained vehemently of visual problems that were diffuse in nature. I performed a VEP, the results of which were totally abnormal. The detection of the electrical signal was nearly extinguished in both low- and high-contrast tests, and at various grading sizes, indicating that a significant neurologic abnormality was present. The PERG showed excellent magnitude, demonstrating healthy RGCs. We forwarded this test to her neurologist, and with it they were able to move towards a diagnosis of a major neurological problem that was previously undetected. In this case, the patient did have raised IOP, making the case for glaucoma plausible. However, VEP testing allowed us to substantiate her subjective complaints and find the neurological, rather than ocular, origin.
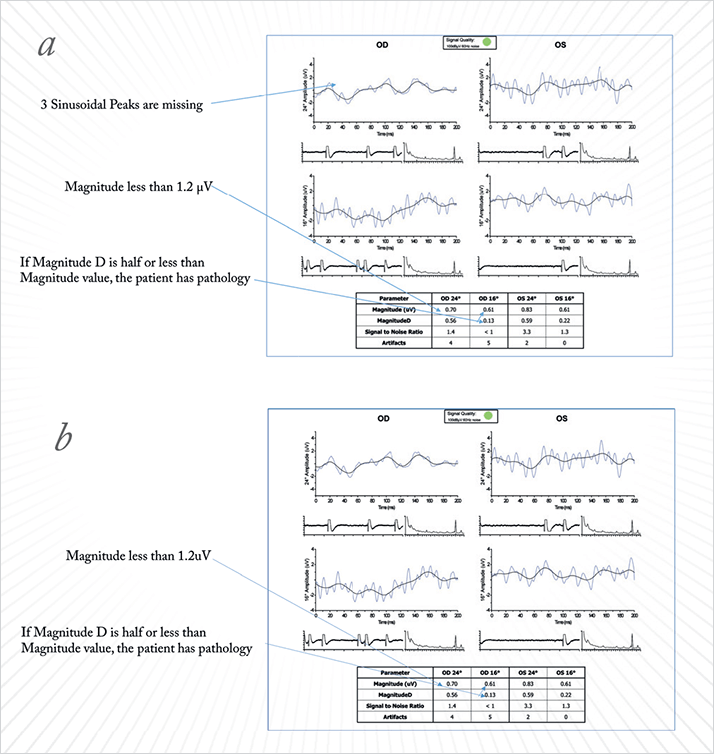
Case Study 5 A 70-year-old male presented with VA of 20/20 in both eyes (OU) and IOP of 17 mmHg in the left eye and 15 mmHg in the right eye. His visual field testing showed field defects superonasally and diffuse effects in his left eye. HRT imaging showed disc cupping in both eyes. We were unsure if this patient had stable IOPs and could be watched, or if he needed additional intervention, so we performed VEP and PERG tests. Both his amplitude and latency were significantly lower than normal in the VEP, confirming that the disc cupping and other visual effects detected were causing functional defects, which provided us with a quantitative assessment of the degree of damage to the optic nerve. The PERG also confirmed reduced voltage amplitudes and MagnitudeD values of less than 50 percent of the amplitude with a poor waveform. This patient had far more advanced retinal damage than we would have thought, which encouraged us to treat this patient very aggressively with surgery, rather than simply watch and wait or advise that he takes additional topical medications.
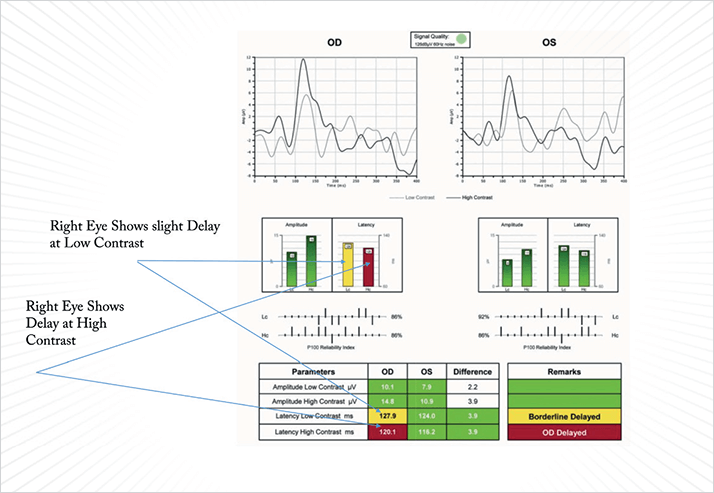
Case Study 6 A 27-year-old male presented with VA of 20/20 and IOP of 14 mmHg OU. HRT showed some disc cupping, so we proceeded with NOVA VEP testing to evaluate if the cupping was affecting optic nerve function. The amplitude was within normal limits, with some delay in latency at high-contrast OU. However, there was significantly decreased amplitude in the right eye indicating the potential for substantial damage. We then performed PERG testing hoping to be able to clarify the location and severity of the pathology, and found that the patient had a basically extinct PERG signal. This is a very ominous sign of severe glaucomatous damage, especially for such a young patient. We made the decision to treat this patient very aggressively, recommending surgery rather than continue to change topical medications, to prevent further deterioration of the optic nerve.
Tracking treatment success
In most cases, the earliest signs we detect of glaucoma are permanent atrophic changes to the optic nerve. However, recent studies have shown that damaged, but still viable, RGCs precede the destruction of the optic nerve (3–5). Multiple studies have found PERG and VEP testing capable of discriminating between healthy and glaucomatous eyes, including detection of impairment of the innermost retinal layers in spite of normal optic disc morphology and visual field analysis (5–7). In fact, PERG in particular, has been established to reveal glaucoma-related damage several years prior to visual detection of deterioration of the retinal nerve fiber layer via OCT imaging (8).Some studies have already found that when initial RGC stress is detected with PERG – and IOP is appropriately lowered – the dysfunction of the RGC cells can be reversed (9,10). Selective laser trabeculoplasty (SLT) is my preferred first-line glaucoma treatment, having proven to be as effective as medications (11) without patient compliance issues, and we now use PERG to measure disease stabilization or the need for further treatment after SLT. To summarize, electrophysiology objectively measures the function of the entire visual pathway, from the eyes to the visual cortex. VEP analyzes the entire system, while PERG can focus on RGC function. Together, they can provide comprehensive diagnostic information as well as better monitoring for treatment effect for a variety of subclinical disorders that affect visual. Somewhat amazingly, we can now perform these tests in an ophthalmologist’s office (rather than in an academic setting) in under a minute, with a compact instrument that’s easy to use, non-invasive and comfortable for the patient. It truly is impressive to see how advancements in technology have been able to open up the world of electrophysiology to a vastly greater number of ophthalmologists – and patients.
Mark Latina, is currently an Associate Clinical Professor of Ophthalmology at Tufts University Medical School and a Surgeon in Ophthalmology at Mass. Eye and Ear Infirmary, Boston, MA.
References
- B. Skarf, et al., “Neuro-ophthalmologic examination: The visual sensory system”,In Neuro-ophthalmology. Edited by Joel S. Glaser. Page 8. Lippincott Williamsand Wilkins, 1999.
- M. Bach, et al., “ISCEV standard for clinical pattern electroretinography (PERG): 2012 update”, Documenta Ophthalmologica, 126, 1–7 (2013). DOI:10.1007/s10633-012-9353-y.
- W. Rokicki, M. Dorecka, W. Romaniuk, “Retinal ganglion cells death in glaucoma–mechanism and potential treatment. Part I”, Klin Oczna, 109, 349–352, (2007).
- V. Porciatti, L. M. Ventura, “Retinal ganglion cell functional plasticity and optic neuropathy: a comprehensive model”, J. Neuroophthalmol., 32, 354–358(2012). doi: 10.1097/WNO.0b013e3182745600.
- L. M. Ventura, et al., “The relationship between retinal ganglion cell function and retinal nerve fiber thickness in early glaucoma”, Invest. Ophthalmol. Vis. Sci., 47, 3904–3911 (2006).
- C. Pillai, et al., “Sensitivity and specificity of short-duration transient visual evoked potentials (SD-tVEP) in discriminating normal from glaucomatous eyes”, Invest. Ophthalmol. Vis. Sci., 54, 2847–2852 (2013). DOI: 10.1167/ iovs.12-10097.
- V. Parisi, et al., “Clinical ability of pattern electroretinograms and visual evokedpotentials in detecting visual dysfunction in ocular hypertension and glaucoma”,Ophthalmology, 113, 216–228 (2006).
- M. R. Banitt, et al., “Progressive loss of retinal ganglion cell function precedesstructural loss by several years in glaucoma suspects”, Invest. Ophthalmol. Vis.Sci., 54, 2346–2352 (2013). DOI:10.1167/iovs.12-11026
- L. M. Ventura, V. Porciatti, “Restoration of retinal ganglion cell function in early glaucoma after intraocular pressure reduction: a pilot study”, Ophthalmology, 112, 20–27, (2005).
- M. Sehi, et al., “Reversal of retinal ganglion cell dysfunction after surgical reduction of intraocular pressure”, Ophthalmology, 12, 2329–2336, (2010). DOI
- M. Nagar et al., “A randomised, prospective study comparing selective laser trabeculoplasty with latanoprost for the control of intraocular pressure in ocularhypertension and open angle glaucoma”, Br. J. Ophthalmol., 89, 1413–1417 (2005).