Educational content provided by Alimera Sciences.
Modern medicine is blessed with a myriad of measures, both quantitative and qualitative, which are available to assess treatment outcomes. Ophthalmology is no different, and for patients with diabetic macular edema (DME), there is a place for both. The proponents of each have long been debating which is better. In most cases both types of data will complement each other, producing a more rounded picture on which to base the success or failure of treatment. This is particularly pertinent to DME treatment outcomes, where clinicians routinely refer to quantitative measures, while for the patient, qualitative measures are far more relevant, reflecting his/her quality of life (QoL). One of the most devastating consequences of DME is the progressive loss of patients’ independence. When assessing treatment outcomes, in addition to quantitative measures, the qualitative effect of any treatment must also be considered. Patients are far more interested whether their QoL has improved—whether they can drive, put the keys in the front door, read, and generally cope with their daily lives—than whether their visual acuity (VA) has improved or deteriorated by a measurable and quantifiable degree. Below, we will consider quantitative and qualitative measures currently used to assess treatment outcomes in DME.
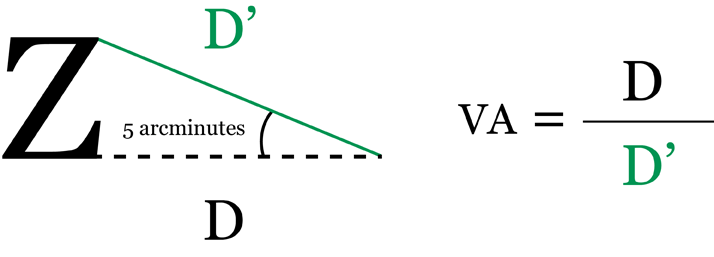
Quantitative measures Visual acuity charts Visual acuity is a measure of a person’s central vision and ability to distinguish details and shapes of objects; in other words, their clarity of vision and the spatial resolving capacity of the eye.1,2 Assessment of VA is an essential component of measuring the effectiveness of DME treatment.3,4 In practice, VA is measured using specialized eye charts. Numerous versions are available; Snellen and Early Treatment Diabetic Retinopathy Study (ETDRS) charts are most commonly used.2 Snellen scale The Snellen scale was developed by the Dutch ophthalmologist Hermann Snellen in 1862. It is the most commonly used test to assess distance VA and consists of a single letter from the Roman alphabet at the top of the chart, followed by ten further rows of letters decreasing in size but increasing in number towards the bottom of the chart (Figure 1). The smallest row that can be accurately read by each eye individually indicates VA in that eye.2 The letters on the chart are not as we would expect from a typographer’s font kit. They are known as optotypes and display simple geometry. Only ten common Latin letters are usually used. The chart would be read from a distance of 6 m (20 ft). At this distance, one line is designated 6/6 (or 20/20). This is the smallest line that a person with normal acuity would be able to read. VA is determined by dividing the distance at which the chart is read by the distance at which the smallest identified optotype subtends an angle of five arcminutes (Figure 2).2 Despite their popularity, Snellen charts have various limitations, such as variable letter size, unequal number of letters on each line, and a lack of standardization between the lines.2
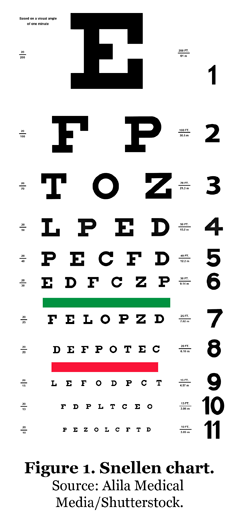
Figure 2. Visual acuity calculation. An arcminute is a unit of angular measurement equivalent to 1/60 of a degree.5 D=distance.
Bailey-Lovie chart Developed in 1976 by Ian Bailey and Jan E Lovie-Kitchin at the National Vision Research Institute of Australia, the Bailey-Lovie VA chart was designed to overcome some of the deficiencies of the Snellen chart and enable a more accurate VA estimation. It uses a logarithm of minimal angle of resolution (LogMar) to determine VA and is the recommended chart, particularly in a research setting. It has certain advantages over the Snellen chart, including the ability to more accurately estimate acuity. For instance, each line contains the same number of characters, all utilizing Sloan letters (a variation in the font used for VA charts, still on a 5x5 grid but without serifs). Despite this, its uptake, especially in clinical practice, has been slow—possibly due to the scoring system and increased time and cost involved.2
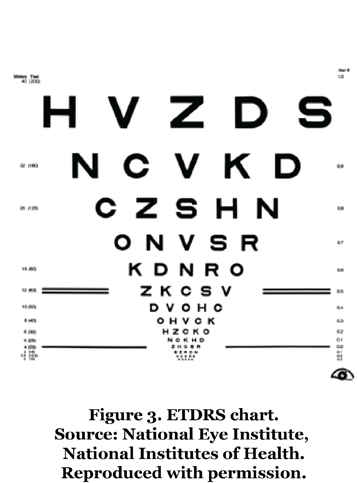
Early Treatment Diabetic Retinopathy Study chart The Bailey-Lovie chart was further modified in 1982 as part of the ETDRS.2 The ETDRS VA chart utilizes LogMAR principles and Sloan letters, with scoring procedures that include letter-by-letter counting, which allows even minor changes in vision to be detected free of chart artifacts.6 Similar to the Bailey-Lovie chart, the ETDRS chart consists of a set of 10 letters arranged in groups of five letters per line. The chart has 14 lines, with a halving of letter sizes every third line from top to bottom (Figure 3).4 A letter score is then generated from 0 to 100, representing the number of letters read correctly. A higher score represents a better VA, with a score of ~85 being considered as “normal” or average vision.3 A one-line change on the ETDRS chart corresponds to a five-letter score change (improvement or worsening). A three-line change in ETDRS represents a doubling or halving of VA.7 Traditionally, a change of ≥15 letters is a common clinical trial benchmark for the effectiveness of a treatment; however, recent literature has shown that even a five- or 10-letter change is associated with statistically significant changes in patients’ health-related quality of life (HRQoL).8 ETDRS charts are regularly used in research and are considered the “gold standard” in clinical trials; for example, several studies have indicated a greater performance of ETDRS charts compared with Snellen in measuring VA, particularly when measuring poor VA (<20/200) and in patients with exudative age-related macular degeneration. However, Snellen charts are still more routinely used, as VA testing using ETDRS charts is more time-consuming, calling into question their cost-effectiveness.2,9
Key outcome measures in randomized controlled trials Best-corrected visual acuity Best-corrected visual acuity (BCVA) is a key measure of efficacy in randomized controlled trials (RCTs) of DME. It is a measure of a patient’s best VA while wearing glasses or contact lenses and is typically determined using an ETDRS chart. BCVA is presented as a number of letters. Across RCTs, numerous BCVA-derived endpoints have been utilized; the mean change in BCVA from baseline, the mean average change in BCVA from baseline, and the proportion of patients with a ≥15-letter improvement in BCVA from baseline are most common.10,11 BCVA is often used in conjunction with morphological assessment measures, such as central retinal thickness (CRT). Central retinal thickness CRT—also termed foveal thickness—is commonly used in clinical studies as a direct measure of macular edema. Typically determined using optical coherence tomography (OCT), CRT-associated endpoints include the mean change in CRT from the baseline and the proportion of patients with CRT equal to or below a predefined value.10,11 Clinical studies have demonstrated that increases in CRT occur in the early stages of diabetic retinopathy and are associated with reductions in VA.12 Other studies have observed only modest correlations between center-point retinal thickness and VA. In addition, a wide variation in VA has been observed for a given degree of retinal thickening. Paradoxical increases in CRT together with VA and paradoxical decreases in CRT with reductions in VA have also been noted; therefore, CRT cannot be used as a surrogate for VA.13 However, a recent Cochrane review determined that OCT can detect early subclinical retinal thickening in individuals without clinically significant macular edema and could potentially be used as a reference standard for its diagnosis.14 Assessing the anatomical changes of DME, in addition to VA, is important when making decisions on a patient’s treatment pathway, as they may be a useful predictor of the patient’s likely response to therapy. Before a loss of VA, patients may also experience waviness, blurring, relative scotoma and a decrease in contrast sensitivity, which are not assessed and quantified during routine examination. These early visual changes, as well as retinal function and structure, may be assessed using microperimetry.15 Microperimetry Microperimetry assesses the visual function of a specific area of the retina and fovea, which is then correlated with structural changes, providing a quantifiable way to measure the regression or progression of retinal visual function. It achieves this by monitoring retinal visual function across different light thresholds, against retinal thickness or structure and the condition of the patient's foveal and extrafoveal fixation over time.15,16 Retinal fixation stability and location are important parameters to determine the quality of a patient’s vision. Eyes with predominantly central and stable retinal fixation have better VA than those with deteriorating stability and/or position of fixation, which is independent of edema characteristics.17,18 Microperimetry may be more sensitive than BCVA in the evaluation of functional responses after intravitreal therapy in DME; for example, one RCT showed that treatment of chronic DME with a fluocinolone acetonide intravitreal implant led to a favorable anatomic response and to an improvement in fixation stability in more than half of the patients, despite poor gains in BCVA. Microperimetry could be a useful additional outcome measure in clinical practice.19 In addition to a comprehensive functional and anatomical evaluation of DME, a number of qualitative measures may also help to determine the impact of DME and its treatment on a patient.
Qualitative measures Qualitative measures, such as interviews, observations and questionnaires that measure HRQoL, are a good indicator of the efficacy of a patient’s treatment. A number of questionnaires have been designed to measure QoL in those with diabetes and retinal disease:
- Audit of Diabetes-Dependent Quality of Life questionnaire consists of two parts, the first of which measures generic overall QoL. A further 19 items consider the impact of diabetes on specific aspects of life, such as physical health, work, leisure activities, family life and close personal relationships. Respondents evaluate how life would be if they did not have diabetes. Data from the questionnaire are combined with the patient’s demographic data, duration of illness, and any existing complications of diabetes they may have.20
- Retinopathy-Dependent Quality of Life questionnaire is modeled on the Audit of Diabetes-Dependent Quality of Life questionnaire. It measures individualized QoL by allowing participants to indicate the impact of their condition on different aspects of life, and how important these aspects are to them.21
- Macular Degeneration Quality of Life questionnaire consists of two parts. The first collects personal and demographic data such as age, sex, race and ethnicity. The second consists of a two-part question: how long an individual expects to live, and how long they would be prepared to live for if a treatment existed that would permanently cure them but decrease the length of their life.22
Conclusion A range of quantitative and qualitative measures evaluating anatomical, functional and HRQoL aspects are available to assess and monitor not only the vision but also the general well-being of patients with DME. An accurate and comprehensive assessment, including a combination of these measures, is important to understand the impact that the disease and any treatments have on the patient, and to enable appropriate decisions about a patient’s treatment pathway. Evaluation of any potential new treatment requires not only an assessment of its effect on visual function, but also consideration of the patient’s satisfaction and the impact of the treatment on his/her condition and QoL.21
Sara Vaz-Pereira, MD, is a graduate of the Faculty of Medicine, University of Lisbon, Portugal. She completed her ophthalmology residency at the Hospital de Santa Maria, Lisbon and a fellowship in medical retina at Moorfields Eye Hospital, London, UK. During her training, she was awarded several prizes at ophthalmology meetings and a clinical research scholarship in diabetes. In 2013, she was the recipient of the Portuguese SOE (European Society of Ophthalmology) Lecture diploma, awarded to highly promising young clinicians and researchers. Currently, Dr Vaz-Pereira works as a consultant Ophthalmologist at Hospital de Santa Maria, and is an invited Lecturer at the Faculty of Medicine of Lisbon. Her main research interests include medical retina imaging, diabetic retinopathy and AMD.

Look out for DME content developed by Alimera Sciences on this website. We hope it supports your knowledge of DME, and if you would like to contribute material for publication, please send your materials to dmecontenthub@hayward.co.uk, we’d be very pleased to consider your contributions.
REFERENCES
- Boots WebMD, “Visual acuity”, (2015). Available at: www.webmd.boots.com/eye-health/guide/visual-acuity. Accessed September 24, 2015.
- PK Kaiser, “Prospective Evaluation of Visual Acuity Assessment: A Comparison of Snellen Versus ETDRS Charts in Clinical Practice (An AOS Thesis)”, Trans Am Ophthalmol Soc, 107, 311–314 (2009). PMID: 20126505.
- Early Treatment Diabetic Retinopathy Study Research Group, “Early treatment diabetic retinopathy study design and baseline characteristics”, Ophthalmology, 98, 741–756 (1991). PMID: 2062510.
- Early Treatment Diabetic Retinopathy Study Research Group, “Photocoagulation for diabetic macular edema: Early Treatment Diabetic Retinopathy Study report number 1”, Arch Ophthalmol, 103, 1796–1806 (1985). PMID: 2866759.
- Oxford Dictionaries, “Arcminutes”, (2015). Available at: www.oxforddictionaries.com/definition/english/minute. Accessed September 24, 2015.
- Evidence-Based Practice (EBP) for Optometry, “Development and adoption of Visual Acuity charts based on the “logMAR” principles”, (2015). Available at: www.eboptometry.com/content/optometry/ebp-resource-step-4-apply/practitioners-students-teachers/development-and-adoption-visual-acuity-charts-based-%E2%80%9Clogmar%E2%80%9D-principles. Accessed September 24, 2015.
- NZ Gregori et al., “Novel method for analysing Snellen visual acuity measurements”. Retina, 30, 1046–1050 (2010). PMID: 20559157.
- Y Liu et al., “Assessing the clinical meaningfulness of a 1-line average change in visual acuity in patients with diabetic macular edema: evidence from health-related quality of life changes”, Poster presented at the International Society for Pharmacoeconomics and Outcomes Research 16th annual European Congress, 3–7 November 2012, Berlin, Germany.
- L-A Lim et al., “Comparison of the ETDRS logMar, ‘compact reduced logMar’ and Snellen charts in routine clinical practice”, Eye, 24, 673–677 (2010). PMID: 19557025.
- P Mitchell et al. on behalf of the RESTORE Study Group, “The RESTORE Study: ranibizumab monotherapy or combined with laser versus laser monotherapy for diabetic macular edema”, Ophthalmology, 118, 615–625 (2011). PMID: 21459215.
- QD Nguyen et al. on behalf of the RISE and RIDE Research Group, “Ranibizumab for diabetic macular edema. Results from 2 phase III randomized trials: RISE and RIDE”, Ophthalmology, 119, 789–801 (2012). PMID: 22330964.
- RZ Hannouche, MP Avila, “Retinal thickness measurement and evaluation of natural history of the diabetic macular edema through optical coherence tomography”, Arq Bras Oftalmol, 72(4), 433–438 (2009).
- Diabetic Retinopathy Clinical Research Network, “The relationship between OCT-measured central retinal thickness and visual acuity in diabetic macular edema”, Ophthalmology, 114(3), 525–536 (2007). PMID: 17123615.
- G Virgili et al., “Optical Coherence Tomography Measurement of Central Retinal Thickness to Diagnose Diabetic Macular Oedema”, Cochrane Database of Syst Rev, Issue 1. Art. No.: CD008081 (2015). PMID: 21735421. Available at: onlinelibrary.wiley.com/doi/10.1002/14651858.CD008081.pub3/abstract;jsessionid=2B94B7F94A1BE5906DD74611B316B5C2.f04t03. Accessed September 24, 2015.
- E Midena, S Vujosevic. “Microperimetry in diabetic retinopathy”, Saudi J Ophthalmol, 25, 131–135 (2011). PMID: PMC3729332.
- Optos, “Microperimetry”, (2015). Available at: www.optos.com/en/Products/Retinal-imaging-products. Accessed September 24, 2015.
- P Carpineto et al., “Fundus microperimetry patterns of fixation in type 2 diabetic patients with diffuse macular edema”, Retina, 27(1), 21–29 (2007). PMID: 17218911.
- S Vujosevic et al., “Retinal fixation impairment in diabetic macular edema”, Retina, 28(10), 1443–1450 (2008). PMID: 18997608.
- C Dubois-Roussel et al., “Increased fixation stability after intravitreal treatment for chronic diabetic macular edema: a marker for favorable visual outcome”, Poster presented at ARVO. Poster No. 1777-A0210.
- E Turk et al., “An Audit of Diabetes-Dependent Quality of Life (ADDQOL) in Older Patients with Diabetes Mellitus Type 2 in Slovenia”, Value in health regional issues, 2, 248-253 (2013).
- LS Brose, C Bradley, “Psychometric Development of the Individualized Retinopathy-Dependent Quality of Life Questionnaire (RetDQoL)”, Value in Health, 13(1), 119–127 (2010). PMID: 19695003.
- J Mitchell et al., “+Psychometric evaluation of the MacDQoL individualised measure of the impact of macular degeneration on quality of life”, Health Qual Life Outcomes, 3, 25–40 (2005). PMID: 15831093.
- GS Magwood et al., “A review of systematic reviews evaluating diabetes interventions”, Diabetes Educ, 34, 242–265 (2008). PMID: 18375775.
Founded in 2003, Alimera Sciences researches and develops innovative vision-improving treatments for chronic retinal diseases, such as diabetic macular edema (DME), dry age-related macular degeneration (AMD), and retinal vein occlusion. In 2015, Alimera Sciences partnered with The Ophthalmologist to facilitate the publication of independently created educational content surrounding DME, a serious retinal complication associated with diabetes, which is increasing in incidence with the increasing prevalence of diabetes worldwide. Published content will include articles ranging from basic science and disease processes to overviews of clinical data, different surgical procedures, comparisons of treatment options, and practical advice for managing diabetic patients. With a commitment to honesty, integrity, responsibility, candor, and trust, Alimera Sciences intend to provide educationally focused content to healthcare professionals across a wide range of topics in DME in order to both increase disease awareness and understanding, and to help improve patient outcomes. UK-ILV-MMM-0355 Date of preparation: August 2015 enquiries@alimerasciences.com