- The Snellen visual acuity chart, developed in 1862, continues to be widely used
- Antiquity and ubiquity bear no relation to its quality
- ts use can prolong the wait patients have for interventions
- ETDRS vision charts are better, but not the ultimate solution
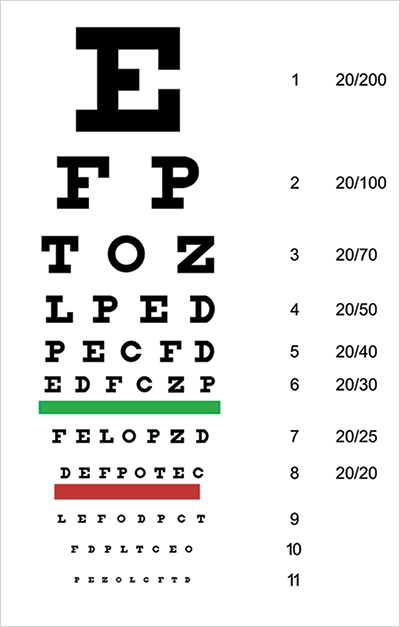
When cataract surgeons assess visual function, we almost always use Snellen charts (Figure 1). We should be ashamed of this. Why, in 2014, are we using a 19th century pictogram, with many obvious drawbacks to describe our treatment outcomes? Why don’t we have a more useful real-world test of visual performance and visual function by which to judge both visual disability and our visual outcomes? In fact, we do.
When cataract surgeons assess visual function, we almost always use Snellen charts (Figure 1). We should be ashamed of this. Why, in 2014, are we using a 19th century pictogram, with many obvious drawbacks to describe our treatment outcomes? Why don’t we have a more useful real-world test of visual performance and visual function by which to judge both visual disability and our visual outcomes? In fact, we do.
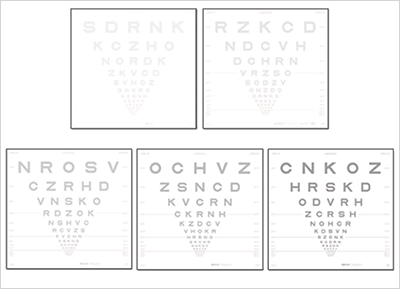
Incorporating contrast sensitivity into visual assessments is one of the best methods of obtaining a comprehensive assessment of visual acuity, both before and after cataract surgery. Although not widely used in the clinic, the Early Treatment Diabetic Retinopathy Study (ETDRS) vision charts (Figure 2) are a considerable improvement on the Snellen chart. They contain the same number of letters per row (five); the letters and rows are both equally spaced out (on a logarithmic scale), and individual rows are balanced for letter difficulty, and they contain an additional advantage, namely contrast sensitivity.
The identification of contrast sensitivity problems is important. The potential causes of contrast sensitivity loss are many – ranging from corneal opacities and refractive issues to macular degeneration and neurological disease. But no matter the cause, loss of contrast sensitivity is a strong predictor of later visual acuity loss (1) and is worthy of investigation. Most visual acuity assessments (like the Snellen chart) measure the ability of patients to recognize small, high-contrast objects (mostly black letters on a white background) under controlled, bright lighting conditions. But in the real world, it’s not the size of the object that can cause problems, it’s the contrast. Not seeing the last step on a flight of stairs or the kerbstone between the road and the sidewalk and falling over isn’t a function of the relative sizes of the objects, it’s a function of small differences in contrast between them. Many studies of the real-life function of patients have found that poor contrast sensitivity has a major impact on patient quality of life, such as that measured by the Activities of Daily Living (ADL) scale (2). So that’s one great reason for considering contrast sensitivity: patient quality of life.
I have patients coming into my office with early cataracts, and they’re saying, “You’re telling me that I have a little bit of cataract in there. Well, can you take it out?” If I use the Snellen chart I would say “Well, physically, sure, there’s nothing stopping me from taking it out. But it’s not yet time, you’re only 20/30.” If I took it out, their post-surgical visual acuity might only show a small improvement to 20/25, prompting the question of how much visual improvement the government or the private insurance company actually bought with that procedure. Yet, I’m often told, “I’m having difficulty, please take them out”. When I do the procedure, the patients come back and say, “The improvement of my visual performance is amazing”, and I sit with my Snellen charts and have to say, “Well, I believe you and I’m really happy to hear this but we just don’t have the ability to document it.”
Clearly, we’re not using the right measures. The implementation of contrast sensitivity in ETDRS isn’t perfect, and the use of the Latin alphabet is inappropriate for some geographical regions – the workarounds for non-Latin alphabet-using countries like modified charts with rotated Es or broken circles are less than ideal. We can, perhaps, do even better that ETDRS.
I think that industry, and the profession as a whole, needs to decide on a better visual performance standard. So this is a call to action. Please, ophthalmologists, optometrists, researchers and visual physiologists, let’s pull together and develop a standard worthy of the twenty-first century and not the nineteenth. To drive acceptance of a new standard (and improve the lives of our patients) we need to ask the journals to mandate that all reporting of visual function tests has to be in this new standard and to reject any manuscript that solely reports Snellen acuities. It’s an easily achievable target, and it’s one that would benefit almost all aspects of the clinical practice of ophthalmology and optometry – and our patients.
References
- M.E. Schneck, “Low contrast vision function predicts subsequent acuity loss in an aged population: the SKI study”, Vision Res., 44, 2317–2325 (2004). 10.1016/j.visres.2004.04.018. B.L. Lam et al., “Longitudinal relationships among visual acuity and tasks of everyday life: the Salisbury Eye Evaluation study”, Invest. Ophthalmol. Vis. Sci., 54, 193–200 (2013). doi: 10.1167/iovs.12-10542.