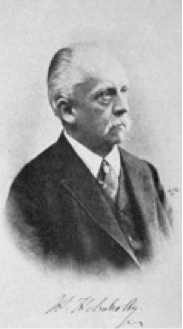
Retinal imaging today is tremendous: there’s no comparison between what we can do today and what Hermann von Helmholtz achieved more than 125 years ago with the first ophthalmoscope. But most of these developments have been in the last three decades or so – I’m sure many people reading this will remember approaching a patient in a darkened room with a traditional direct ophthalmoscope and making pencil drawings of what they saw, or taking multiple photographs and having them developed, just to get some sensible images of the retina.
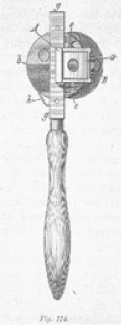
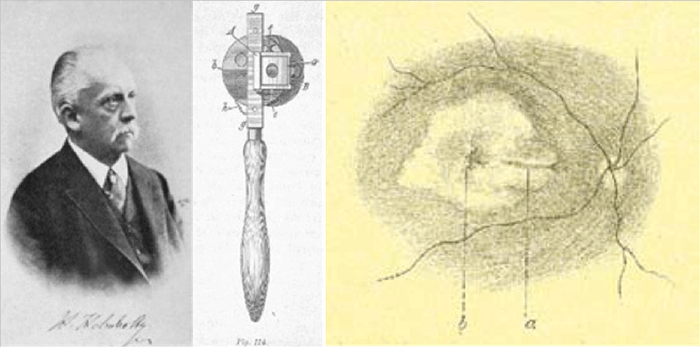
Hermann von Helmholtz; his ophthalmoscope and a pencil drawing of the retina.
The beginnings of BluePeak autofluorescence imaging
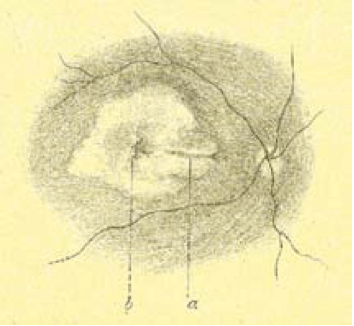
The image below shows one of the first autofluorescence images of the optic nerve – but the optic nerve disc drusen gave an enormously strong signal, which was easy to capture, even with a normal fundus camera. But you need to use far more refined instruments to capture the tiny amounts of autofluorescence in the rest of the eye. When I worked in Heidelberg University I had just come back from a two-year fellowship with Alan Bird at Moorfields in London, and his group had a great enthusiasm about the idea of capturing low signals derived from fluorophores of the retina.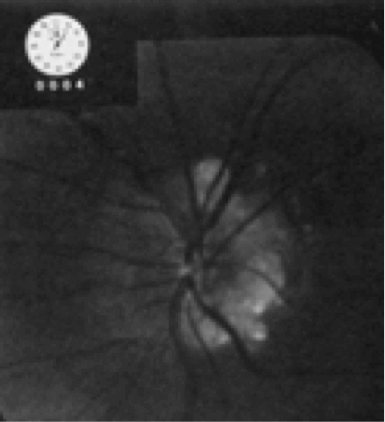
One of the first autofluorescence images of the optic nerve.
In our second floor in our ophthalmology department there was this massive, monstrous instrument (below). Patients were afraid of sitting near it because it made funny noises and looked odd. Reinhard Burk, who, at the time, was my colleague in Heidelberg, was interested in the glaucoma applications of the device, whereas I was interested in the retinal applications.
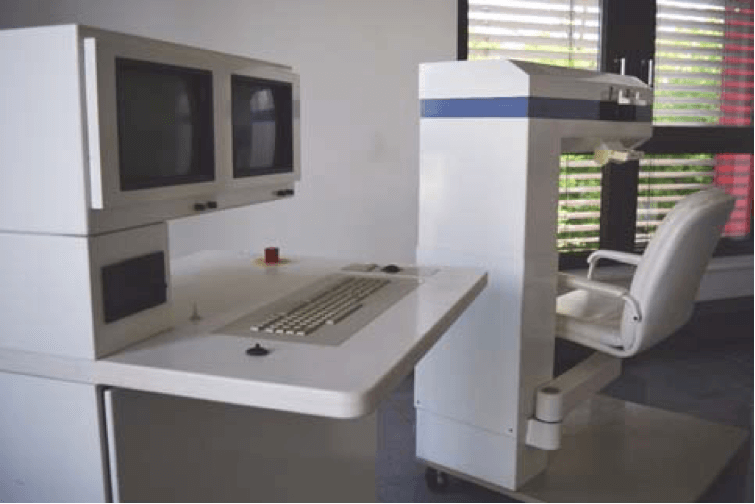
An early “massive, monstrous” retinal scanner.
Clearly, the first step in developing this technology was to miniaturize it. The Heidelberg Retina Angiograph was the result. It was a beautiful instrument and gave us beautiful, “crispy” angiography images, showing us structures that frankly, we were just not used to acquiring with conventional retinal photographs. Thanks to the fantastic work of Gerhard Zinser’s group in Heidelberg, it was modified to include additional laser probes which meant we were able to capture the autofluorescence signal from the back of the eye. It turned out to be fantastic at this, and with all of the other features Gerhard’s group added – eye tracking, image normalization through the averaging of multiple image acquisitions – it meant that we could get in vivo images of the retina that were far more detailed than had ever been achieved before.
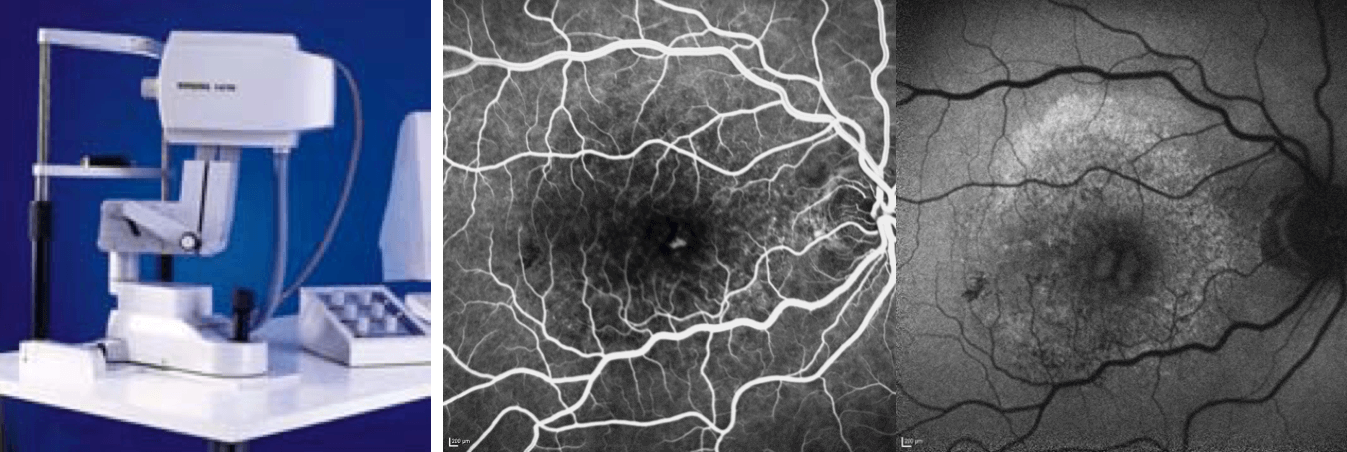
The Heidelberg Retina Angiograph: an example of its “crispy” fluorescein angiography image and a BluePeak autofluorescence image
The age of OCT – and OCT angiography
Then there was another breakthrough: optical coherence tomography (OCT). If you recall, the time domain-based Stratus instrument was where it all started, and it gave you a very pixelated image. Today, spectral domain (SD)-based OCT instruments give you near-histological resolution of the retina – a fantastic step forward from 1856 and Herman von Helmholtz’s first ophthalmoscope.Now there’s the latest development, Heidelberg Engineering’s SPECTRALIS OCT 2 Module, which is what enables us to perform OCT angiography. What it can do is image vessels that have never before been imaged in the living human eye. Why?Almost all retinal diseases with a vascular component have leaky vessels. In fluorescein angiography (FA), fluorescein leaks from the very vessels you are trying to image, masking them from view. If you ask a patient what they’d prefer – a short period in front of an OCT instrument, or being stuck with a needle and filled with a dye that turned them yellow, followed by taking several images over an extended period – I think you can guess their answer. I can see this technology replacing FA for a great number of indications. It’s even useful in animal studies – it works beautifully, and even animals don’t like having the yellow stuff injected. The image below shows an example of a patient with pseudoxanthoma elasticum who underwent FA and showed some unusual staining effects late in the angiography. We were never able to see any vessels with FA, but all of these vessels became visible with OCT angiography – and it’s a similar story with early stages of occult CNV type I disease: OCT angiography reveals the vessels that FA cannot.Ultimately, what I think this means is that OCT angiography will enable us to treat the disease much earlier, before we see advanced morphological changes, and perhaps even before irreversible damage has occurred.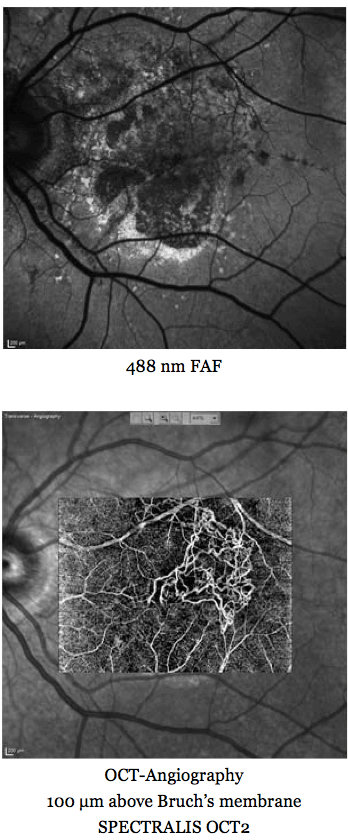
A multimodal imaging approach for imaging retinal vasculature in a patient with pseudoxanthoma elasticum.
Seeing more with SD-OCT, and revealing the secrets of reticular pseudodrusen
SD-OCT is transforming how we treat patients. We routinely use the SPECTRALIS to image, in vitro, patients’ retinae before and after vitreoretinal surgery, giving us a far better idea of both what’s required before the intervention, and what occurs afterwards. Our department also regularly uses the SPECTRALIS’ MultiColor mode, which utilizes three monochromatic laser lights, and can give striking visualizations of vitreoretinal interface alterations and especially of epiretinal membranes. These can present, at first glance, in a very subtle manner – but in MultiColor mode, they really pop out – you see the epiretinal membrane wrinkling all over the place. This is also great for patient education; you can show them all of these images and they immediately understand that they have an issue, and it’s the principal reason for their visual impairment.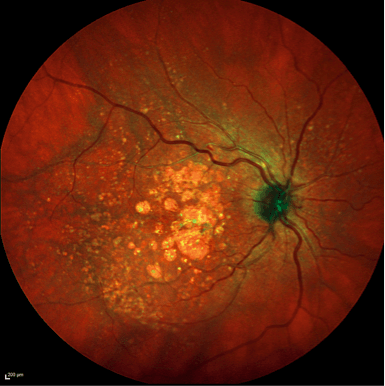
Striking image acquired with SPECTRALIS MultiColor Module.
SD-OCT has revealed many other retinal pathologies to us over its relatively short lifetime to date; these include some of the odd phenotypic variations that we see with age-related macular disease, like the so-called “reticular pseudodrusen” – and you can see them beautifully. You spot them because they have optical properties different from any other material that builds up in the retina. Thanks to SD-OCT, we have learned that these nodes and bumps build up on the “wrong side” of the retinal pigment epithelium, and that reticular pseudodrusen, which were thought to be extremely rare, but, by using the SPECTRALIS, discovered that almost all patients with AMD have these peculiar drusen.
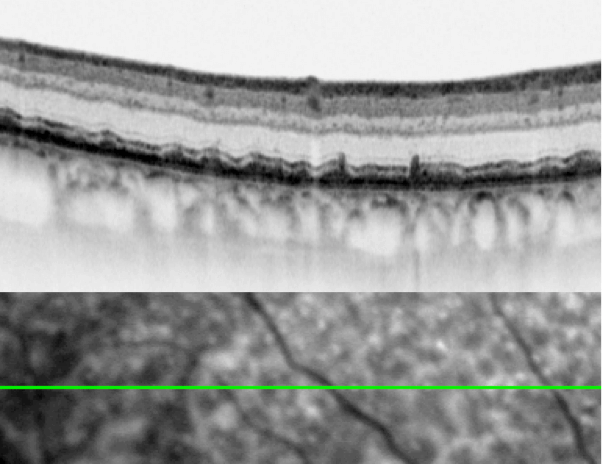
Reticular pseudodrusen visualized by a SPECTRALIS SD-OCT instrument.
Reticular pseudodrusen have some interesting phenotypic manifestations: we have learned that in daylight, patients with them experience no visual problems – however these same patients exhibit a dismal impairment of vision when tested under scotopic conditions. There’s a precise correlation between where patients have this type of drusen and the quality of their night vision – their vision under dim light conditions goes down tremendously, meaning that in this case, at least, there’s a very tight structure-function correlation.
Mapping the relationship between structure and function
Today, you can even precisely measure the outer nuclear layer, enabling you to map the relationships between retinal structure and function, thanks to an algorithm from the software engineers at Heidelberg Engineering. This is important and useful information to have: for example, if one loses just one micron in the outer nuclear layer, scotopic retinal sensitivity is impaired by just under one decibel. Clearly, SD-OCT has opened up a new world of endpoints and endpoint assessments for future clinical trials – and some ongoing ones too. But sometimes morphology doesn’t give you the full picture. The below are put together from reflection and SD-OCT images. The measurements show what the patient’s scotopic sensitivity is by the use of scotopic microperimetry. You see massive morphological changes corresponding with areas with reticular pseudodrusen.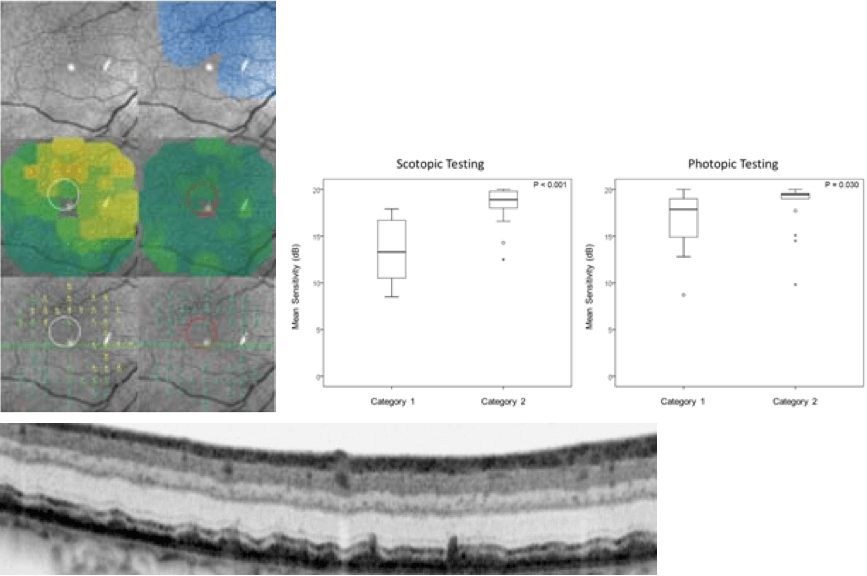
The scotopic and photopic microperimetry of reticular pseudodrusen, per JS Steinberg et al. JAMA Ophthalmol, 133, 690–697 (2015).
What we have today, with instruments like the SPECTRALIS that work on the principle of BluePeak fundus autofluorescence, are the “spectacles” needed to look into retinal cells and actually see metabolic processes… and what we see is toxic waste, predominantly in the RPE, that builds up with age. This was something that had only been visualized previously in donor eyes, yet now we can see this in vivo, in patients. But BluePeak autofluorescence is not just limited to visualizing drusen. There’s an ever-growing “laundry list” of the retinal anatomy (and pathology) that we can use blue peak autofluorescence to view – and this can be very helpful in the monitoring of the early stages of retinal disease progression – and coming up with new prognostic markers, like luteal pigment. We are not limited to using just fundus autofluorescence. Other monochromatic laser light sources can be used to look at other autofluorescence-based phenomena, for example, near infrared autofluorescence. Patients like it, as it’s a very low light intensity, they don’t really see it, and you get additional information on diseased retinal areas that you would not pick up using other imaging modalities.
The transformation of disease detection
These advances are transforming the early detection of retinal disease. The image below shows an example of early disease detection in the context of macular telangiectasia (Mactel) type 2. After the seminal description by Don Gass and Barbara Blodi in the US, this disorder was thought to be a vascular disease and therefore the term “macular telangiectasia” was used. But SD-OCT imaging demonstrated that it’s not primarily a vascular disease, but rather a form of macular dystrophy, which starts at a completely different layer of the retina, and to begin with, has morphologically unaffected retinal vessels.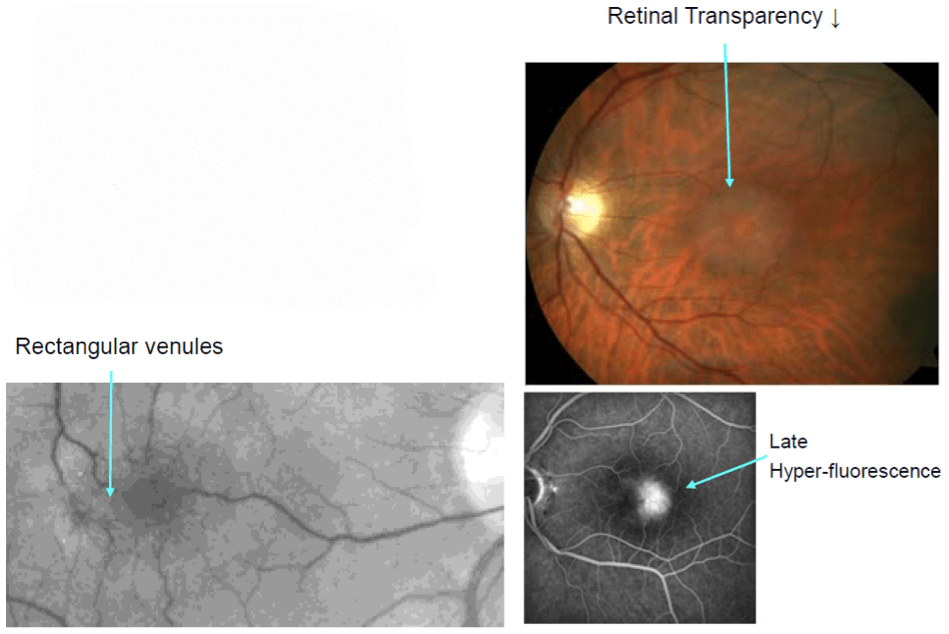
A classic example of Macular Telangiectasia Type 2
You know all the hallmark features of Mactel type 2: loss of transparency, dilated vessels at the temporal side of the fovea and late hyperfluorescence under FA examination. But actually this is only apparent at a later stage of the disease – it was a surprise that when autofluorescence imaging was used, it showed that these patients’ hav reduced luteal pigment– something that was completely unexpected at the time. When I was based in Heidelberg, we tried to publish our findings in the high-ranking peer reviewed journals – they rejected us several times, and they wouldn’t accept this was the case, or at least not until it was proven in donor eye studies. Today, you can make an early disease diagnosis by autofluorescence imaging, making it an easy call to diagnose a patient as having Mactel type 2. This technology offers the opportunity to avoid lumping disease entities into one basket and to look at things in a more refined way. A common analogy is pneumonia. In the old days, there was just one disease called “pneumonia.” That was it. But then the microbiologists and the virologists investigated, and soon they told us that there’s more than 100 different “pneumonias.”It’s not one disease, it’s many
Now we have the “spectacles” to scrutinize the retina, we’re going through the same evolution in retinal disease. You may recall that retinitis pigmentosa was thought to be one disease – now the human geneticists tell us it’s more than 60 different disease entities. Here’s another example: AMD – essentially retinal atrophy of the elderly. It’s not just one clinical entity, but a whole collection of them, and on inspection of the autofluorescence images (below), they all look so different if you just look outside this dark spot of atrophy. Ultimately, it’s pattern recognition that lets you put the right label on the disease. In the examples below – these are two monogenetic diseases, central areolar choroidal dystrophy and late-onset Stargardt disease – and only one patient had AMD. This is of great importance, as it permits appropriate patient selection for future therapies. If you don’t make the proper selection, you might give a treatment that’s suboptimal, or may not work at all. Widefield imaging is important too. Often, disease is not restricted to the macula and goes way out the periphery – and this is something that’s particularly relevant to patients, as peripheral vision is of utmost importance in their daily lives.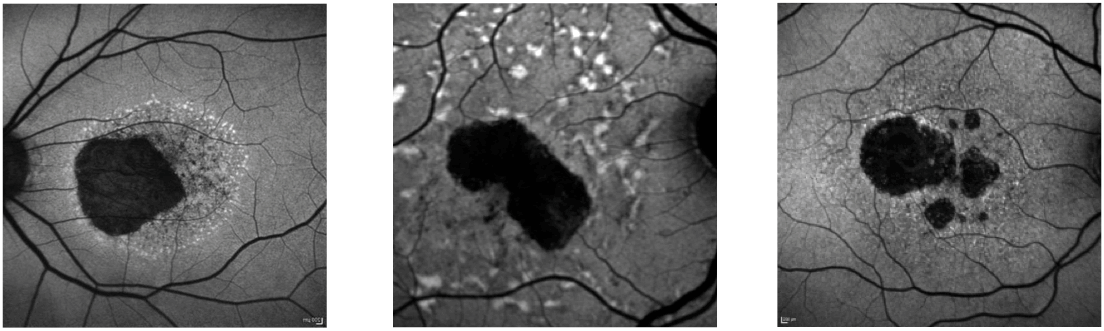
From: S Schmitz-Valckenberg, Prog Retin Eye Res, 39, 23–57 (2014).
Making the subjective, objective
If you examine conventional color photography in AMD, it’s hard to say where there’s atrophy and where there isn’t. Autofluorescence gives you high contrast where the lesion boundaries are – something that was basically impossible before this technology existed. What has been typical is that the user identifies the areas on the computer screen and draws on them with the mouse. But the marvelous people in Heidelberg Engineering were interested in automating these measurements, with a focus on removing the inaccuracies and imprecision of manually drawing these boundaries. The automated method has now turned into a gold standard as an endpoint for all ongoing and planned clinical studies in the space of geographic atrophy, partly because it’s so handy, but mostly because of the accuracy, precision and reproducibility it provides. It’s also a measurement that’s now accepted by all the main regulatory authorities, including the US’ FDA, and the EMA in Europe. The image below shows how the image analysis tool itself finds the boundaries. What this enables you to do is automatically establish the change in growth of atrophy over time. If we want to establish whether treatments are effective in slowing down the growth of this atrophy, you need a system like this to objectively and reproducibly document the change in progression. Once again, this is now accepted as the gold standard assessment in all current and planned clinical trials of agents to treat geographic atrophy. We also need parallel functional measurements, but again tools are already developed and are becoming available.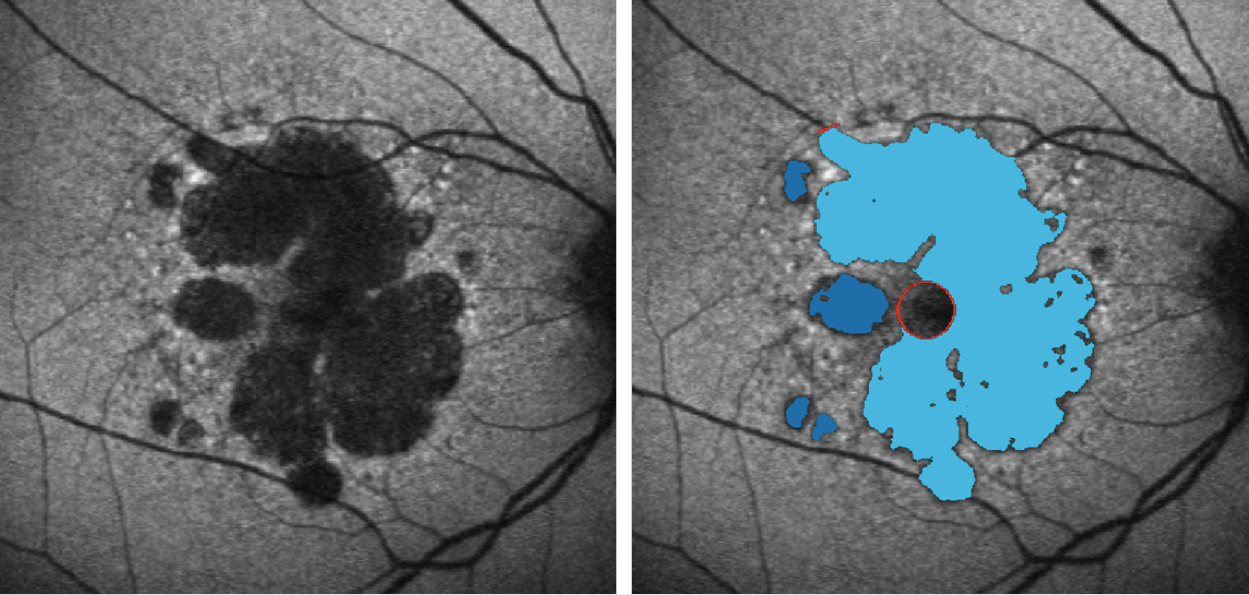
The RegionFinder software allows for accurate quantification of atrophic areas in BluePeak autofluorescence images.
Identifying slow burners and those who will “explode”
The impact of fundus autofluorescence cannot be underemphasized. Today, you can distinguish between the patients who are likely to have a very slow progressive disease and patients that “explode”. This has been shown by numerous studies to date – and every single one of these studies used this automated boundary identifying software – and the SPECTRALIS instrument. The latest development in this respect is examining the foveal island, which is often spared over a long period of time in geographic atrophy. Here, you can use two different imaging modalities: rather than autofluorescence imaging alone (because the yellow pigment absorbs the blue laser light), you also take the infrared reflection image. Together, these images enable one to take detailed measurements on how quickly the foveal island shrinks – and it turns out that the atrophy grows much faster toward the periphery. Again, this is important: if we have a treatment, we need to see how long this treatment can preserve central vision. Even if a treatment had a modest effect of say, a 20 to 30 percent reduction atrophic progression, if this means that fovea survives the three or four years longer than it would have otherwise, this represents a huge impact for the individuals afflicted by this pernicious, vision-robbing disease.The older we grow the more we glow
One of the latest developments in autofluorescence imaging is to quantify the signal that you get. Pioneering work by Françoise Delori has demonstrated that the older we grow, the more we glow (at least in terms of fundus autofluorescence). It starts early on at the age of 20 years, but it really kicks off after the age of 50. This has important implications. Consider for instance the images below of a young patient with normal retinal physiology and another patient with Stargardt disease. Without quantification, we would say that outside these lesions, both images show a pretty similar intensity of signal. But if we measure it against this a reference standard (and you could retrofit the SPECTRALIS instrument to do this) and use the appropriate software, then it turns out that the patient with Stargardt disease has a massive overload of autofluorescent material clogging up their RPE. Once again, this image assessment method has already entered clinical studies and will be very useful also in routine clinical situations when you’re trying to separate hereditary disease from other causes. Lots of retinal dystrophies show an increased autofluorescence signal that you can now measure, meaning you now have a clue as to what disease entity your patient actually has. Conventional Fundus Autofluorescence Imaging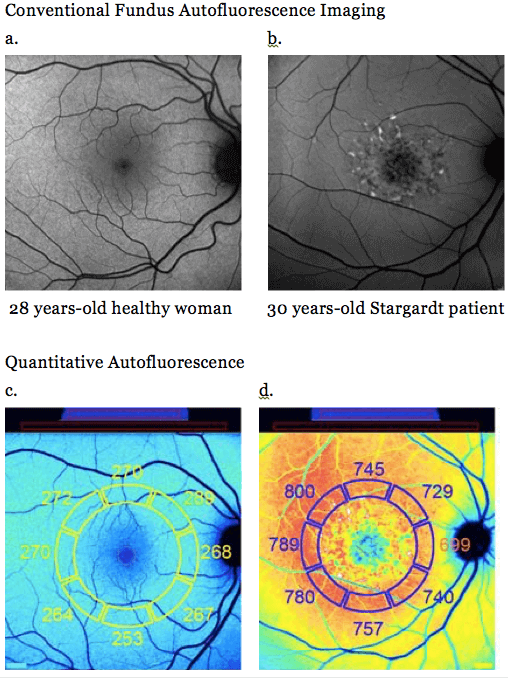
Fundus Autofluorescence imaging of a young patient with normal retinal physiology, and another with Stargardt disease – top images (a and b) show similar signal intensities, whereas quantitative autofluorescence reveals the difference (c and d).
The future of the art – towards molecular imaging
Today, we are even able to identify certain molecules in the retina, and where this is ultimately going is what’s called “fluorescence lifetime imaging ophthalmoscopy” (FLIO). According to the first developments of the time-resolved autofluorescence by Schweitzer et al. in Jena, Heidelberg Engineering implemented this technique in clinical research SPECTRALIS “FLIO” systems. Besides the Jena Group, interesting results were published by a group in Bern, led by Sebastian Wolf. We ophthalmologists have the perfect organ for this purpose – the perfect optics of the cornea and the lens (if it’s clear), and we are now able to detect this low intensity fluorescent light. If we attach fluorescent probes to specific antibodies, this means that we can detect any molecule that we can raise an antibody against, and see molecules being upregulated even before we could see any morphological changes – meaning that disease can be treated at a much earlier stage, perhaps even before permanent damage occurs. We are working to visualize fluorescently-labelled VEGF, to examine VEGF upregulation in an animal model of choroidal neovascularization, and this technique will hopefully moving into humans. This could be a utilized for almost any disease process in the retina – and could be profoundly transformative in terms of patients’ visual outcomes wherever effective treatment is available.A brand becoming a verb
The last 25 years of Heidelberg Engineering has seen some incredible technological advances, which have transformed patients’ care in the eye clinic. But there was one thing I noticed at a recent US meeting of ophthalmologists – a brand becoming a verb. People say they’ve “googled something” whenever they perform a search on the internet. In the US apparently, they use the term “to Heidelberg” something – and I must say that this is something that their competitors have not achieved yet. Congratulations to Heidelberg Engineering on their 25th anniversary this year.Heidelberg Engineering www.HeidelbergEngineering.com