As an optical physics educator and neuroscience researcher in an optometry department, I am involved with a lot of math, physics, and clinical science. As well as these disciplines, I am also an avid illustrator and – as an extension – a huge advocate for the power of illustration as a mechanism for supporting scientific study and developing creative thinking and problem solving skills. In this article, I discuss the benefits of illustration for driving engagement in both clinical and educational settings and why more ophthalmologists should embrace the doodle.
Why illustration?
As far back as I can remember, I have been interested in art – from the slightly frightening (but loving) depictions I “drew” of my father when I was too young to convincingly hold a pen, through to the more scientific, digital creations I produce now. However, what I didn’t realize, until I started teaching, was that my fascination in creativity has inadvertently promoted the development of key skills that I rely on in my scientific career. Most importantly, these skills were born from the act of creating the illustration, rather than being related to the quality of the final illustration itself.
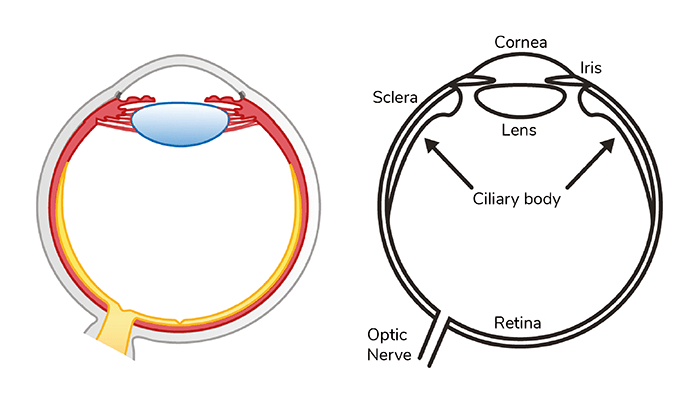
For example, let’s consider a nice ophthalmic example of the anatomical structure of the human eye. Learning anatomy is crucial for healthcare professionals but is notoriously challenging as it usually involves a lot of facts – and some reasonable degree of difficulty in comprehending the relationship between the structures. I remember really struggling to understand the structure of the eye; when memorizing information from the lecture slides, I would mix everything up or confuse the functions across structures. This struggle persisted until one day, out of idle boredom rather than ingenuity, I attempted to draw a cross-section of the eye using only the text notes I had written for myself. It was at this point that I found myself wondering whether the lens truly sat plumb behind the iris, or if it needed a gap – and subsequently, I learnt about aqueous production – and everything started to fall into place (see Figure 1). In pedagogical terms, I had inadvertently created a situation that inspired deeper levels of learning and linking between content, that has been shown to help with student engagement and understanding.
Variations in visualization
The second point I would like to address involves the assumptions we make about other people’s thoughts. For example, if I say to you “imagine an eye” – I cannot easily predict what you will visualize in your mind’s eye – are you thinking of an anatomical eyeball, your own eye, a line drawing, a mid-surgery close-up? This thought experiment demonstrates the idea that, when we describe ideas or concepts to students, peers, and patients, we are assuming that our use of language will allow them to conceptualize what we are thinking. In actual fact, this is rarely be the case – and even less likely when discussing new or difficult concepts, like the ones you may need to explain in an ophthalmic setting. By having an illustration to hand – or the ability to produce a quick sketch, you could really help your listener visualize what you’re trying to tell. And that’s much better than relying on how they may have visualized the information – if at all!
The other benefit of a more visual approach is to support the 0.8–3.9 percent of the global population that have aphantasia – an inability to visualize (1). I fall into this category and so I’m able to appreciate how helpful physical illustrations of complicated ideas and concepts can be. Similarly, if you have a patient who has a different first language, effective illustrations can help highlight key ideas without relying on spoken word.
Developing skills through drawing
In clinical disciplines especially, it is important to think very carefully about how others interpret explanations. It is easy, when chatting with someone, to focus on what you’re about to say instead of reflecting on whether what you just said made sense to the other person. The beauty of the diagram, whether produced live in-person or in advance of a training session, is that it forces you to think carefully about the most effective way to show what you want to tell. This, out of necessity, develops skills in anticipating multiple perceptions of a situation and develops effective problem-solving skills. If one diagrammatic approach doesn’t work as effectively as you hoped, you can reflect and then adapt or add annotations. Therefore, while you are using illustrations, you are also developing creative thinking and associated skills that can help to build on your own personal and professional development.
Generating engagement
Another key benefit of illustration in educational and clinical training is that it engages and interests large cohorts of people. I have witnessed this with my own first-year optometry students in the “basic” optics module, which involves learning about geometric and physical optics that can subsequently be applied to eyes, lenses, light, and imaging throughout their profession. As you may or may not remember from studying this topic yourself, the published resources for supporting these modules are largely free of illustration and often free of color. And that’s not to say the resources are bad – indeed, they are often well-written and comprehensive – but it can mean that the material is not so engaging for students.
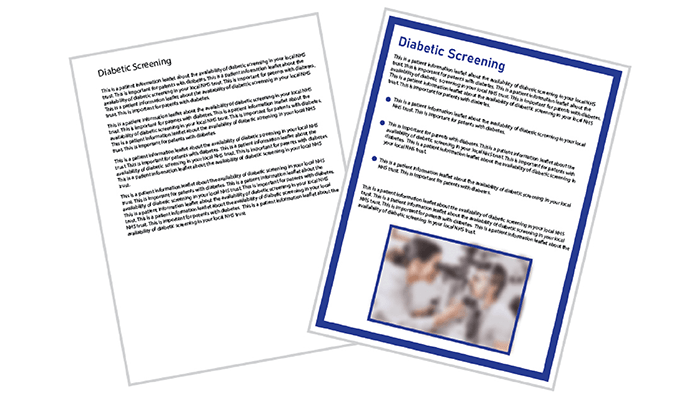
Imagine that you have an important patient information sheet about diabetic screening – one version is uniform black text on white paper and the other has a colorful heading and an image of a smiling patient sitting on a slit lamp. The latter will generate greater interest in our target audience (see Figure 2), and yet, when it comes to education, it can be easy to forget that the same principle applies. In light of this concept, I have recently written and illustrated an introductory textbook in the field of optics that is complete with colorful and inviting illustrations (2). I am hopeful that this textbook will help more students feel comfortable exploring and learning about the wonder of optics!
The elephant in the room
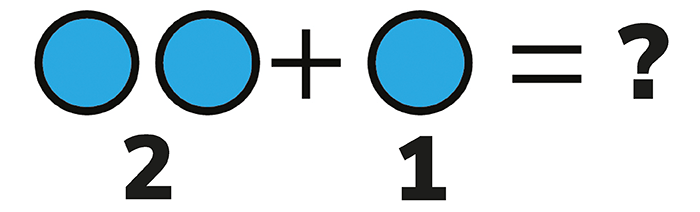
Some people may be deterred from using illustrations in their work or study because they are worried about the quality of the image. But, in most cases, a simple geometric diagram or a useful annotation to an existing image can make a real difference to verbal or written explanations. Consider a child learning math; Figure 3 is not a complex diagram, but it really helps with conceptualizing that three is one more than two.
I would really encourage you – whether clinician or student – to produce your own diagrams in your study or work whenever you find that something might need clarification. You may be able to use digital resources, such as the shape tools in presentation software or you may have access to an institutional license for illustration software. Alternatively, pick up a pen! It is very easy to implement simple line drawings when talking face-to-face with students, peers, or patients. Not only will you inspire people to engage with the content you are sharing, you will also help them more easily remember it.
Let me end with this: Embrace the doodle!
References
- CJ Dance et al., “The prevalence of aphantasia (imagery weakness) in the general population,” Consciousness and Cognition, 97, (2022). PMID: 34872033.
- S Strong, Introduction to Visual Optics: A Light Approach, 1st edition. Elsevier Health Sciences: 2022.