- Currently available computing power has the capacity dramatically to improve medical practice, including ophthalmology
- Huge, messy data sets can now be handled, generating the power to discover or confirm correlations and links between diseases, environment, or a patient's genome
- The IRIS registry is a major development for ophthalmology; we should all participate fully in developments of this type
- Analytics-assisted medicine is ready to go; it is no longer a question of research, but of implementation
The last 30 years has seen ICT (information and communication technology) transform lives and the fundamental way in which whole industries work. Medicine has been slow to adopt and benefit from the potential power of ICT, but the urgent need for cost constraint has led governments to incentivize the use of electronic patient records (EPRs), for example through the “Meaningful Use” initiative in the US and the Technology Fund in the UK. Although a vital building block in digital medicine, EPRs by themselves will not be sufficient to enable the changes required in healthcare; these will need to take advantage of much wider technological trends, both to use information effectively and to realize the levels of efficiency seen in other industries. The major transformational trends in ICT are mobility (the ability to access and interact with information at any time and place), cloud (infinitely scalable data storage and processing, flexed according to demand), and big data, and the combination of these, along with appropriate data security measures, is transformational. ICT-enabled transformation will itself be enabled by parallel, synergistic advances in multiple fields or aspects of technology.
Exploiting computing power
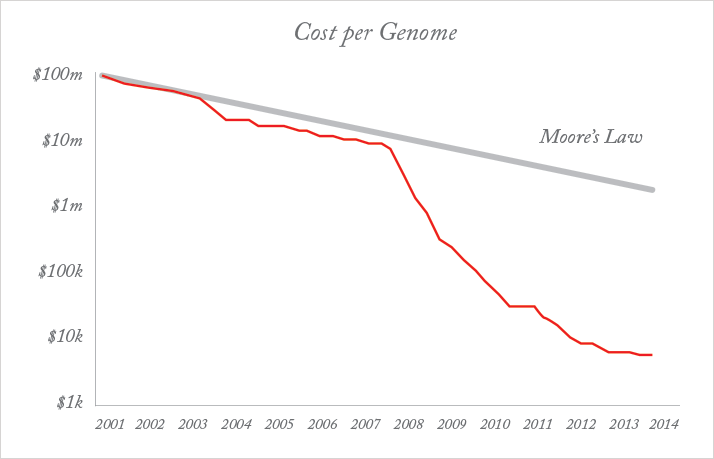
An example of this synergy is the rise of tablet devices and smartphones. While advanced battery technology, lighter and faster processors, and touchscreens were all necessary, the critical advance has been in the way in which people interact with their devices: the “human-machine interface”. The ability to analyze highly complex data is only of real use if the end-user can understand it. That usually means a visual format. Tablets and smartphones provide an intuitive visual interface between person and device, mediated by “apps”, that put heavy-duty computing power in the hands of people who otherwise have no IT knowledge. The latest advance is Google Glass, which offers functionality in a hands-free format, using voice recognition and displaying answers in a “head-up display”. Google Glass is already being used in medical contexts; for example, it allows surgeons to call in colleagues to “see” what they are doing and advise, without the need to scrub up. The shift to voice-operated systems and advances in the understanding of speech and natural language will be the biggest change in human-machine interaction since the touchscreen. It takes advantage of the exponential increase in computing power which might otherwise have been worthless to most people.A related area in which the power of technology has been harnessed is genomics, which is also poised to make a dramatic impact on medicine. The ability to sequence the human genome is in itself a big data exercise: the information in a single human genome takes up around 1.5 TB of storage (20 standard computer hard disks). After initially tracking the “double exponential” of Moore’s law (Figure 1), the rate of reduction of cost per genome sequenced has accelerated, and the $1000 genome was announced in January 2014, several years ahead of the anticipated date (although the cost is only that low with very high volumes of sequencing) (2).
The figure of $1000 is important, because it is about the level at which it becomes economic and cost-effective to sequence large populations. Very powerful processing and vast storage capacity is required to sequence a genome at that price, effectively store the data from many millions of them, and begin the analysis of the relationship between genes and diseases, at the phenotypic and molecular level. Moore’s Law (3) is an observation first made in 1965 by Gordon E. Moore, the co-founder of Intel and, at the time, Fairchild Semiconductor’s Director of Research and Development. It states that “transistor density” (the number of transistors that could be fitted into a unit volume, a correlate of computing power) was doubling every two years, and the cost per unit computing power was being cut by half over the same period. This trend has continued to the present day, although reliable predictions are that it will run its course at around the end of this decade, when minimum component sizes on integrated circuits approach 5 nm.
Other exponential increases have also been noted in ICT, and indeed are necessary in order to make full use of the extraordinary rise in computing power. These include: PC hard disk capacity (Kryder’s Law), where capacity doubles every year, and network capacity (Butter’s Law), where the amount of data that can be moved through an optical fiber doubles every nine months. This relentless exponential acceleration has enabled the rise of big data analytics. However, the transformational power of the developments outlined above is enhanced and, in many cases, only made useful by parallel, exponential developments in a number of related or synergistic fields. Over the next 20 years, industries, and society itself, are likely to see changes that are difficult for us to imagine, driven by the confluence of multiple fields, including artificial intelligence (AI), robotics, biotechnology and synthetic biology, embedded networks, nanotechnology and materials science, and human-machine interfaces.
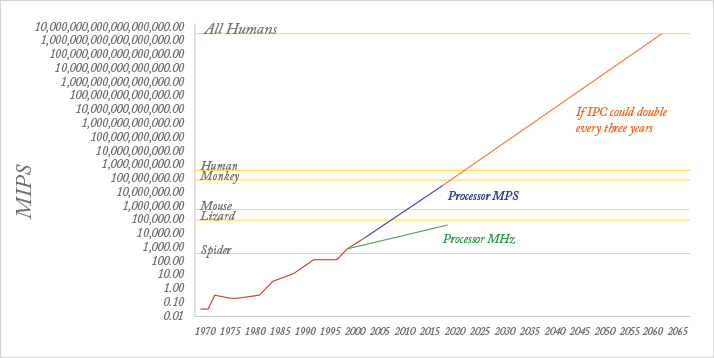
This transformation may become self-sustaining and self-reinforcing. Ray Kurzweil, Google’s head of AI, recently made headlines by predicting that within 15 years, computers will become more intelligent than humans – this future event has been termed the “singularity” (4). Kurtzweil has form. In 1990 he predicted that a computer would beat a World Chess champion by 1998; in 1997, IBM’s “Big Blue” obliged, beating Gary Kasparov. As shown in Figure 2, the processor capacity (in million instructions per second) is today around three orders of magnitude short of that required directly to mimic, or exceed, the power of the human brain, and there are as yet no programs that can mirror the way in which the human brain functions. However, the development of increasingly sophisticated and intuitive human-machine interfaces will continue to “augment human intellect”, rather than replace it.
Big data and medicine
Big data is defined by Forrester as “techniques and technologies that make handling data at extreme scale affordable”. In reality, much of the content of big data has been with us for a long time, but it has been ignored for the purposes of machine-based analytics. Conventional analysis is based almost entirely on the use of structured data, which uses individual defined items, such as time, date, number of items, systolic blood pressure, height, rating scales, etc. However, over 90 percent of available data is in unstructured or semi-structured formats, such as written or spoken language, video and pictures, stored in newspapers, websites, libraries, e-mails, print journals, social networking sites, and so on. This unstructured data has historically been inaccessible to analysis without human intervention. It is exploding in volume: in the two years from 2011, more information was generated and stored than in the whole of world history prior to that, the vast majority of it in social networking sites such as Facebook and YouTube. The analysis and use of big data is still in its infancy, but “improving the use of data and analytics to improve business decisions and outcomes” was the top priority in a survey of over 3,500 firms in late 2012, with 55 percent rating it as of high or critical priority.The practice of medicine and the organization of medical care are quintessentially information-led businesses, and the complexity of modern medical systems is possibly unmatched in any other field of human endeavor. Two UK businessmen with impeccable credentials (John Harvey Jones and Jerry Robinson), both spent time in UK National Health Service hospitals, and both emerged with the view that what they had grappled with was vastly more complex than anything they had met in their business lives. Medical practice is at the confluence of an unparalleled matrix of professional, technical, regulatory, economic, political and social forces. The individual medical practitioner at the front line is required to understand the impact of these, and to maintain his or her skills and knowledge, when the doubling time of conventional medical information is around 10 years, and its half-life around five or six years. The quantities involved are staggering: according to PubMed, in the last five years, there have been around 3,500 studies on hospital readmission, 10,000 on comparative effectiveness, 40,000 on drug-drug interaction and 130,000 on hospital morbidity. Add to this an explosion of unconventional medical data (see below), and the problem becomes even more acute. The processing power of the human brain has remained essentially unchanged for 100,000 years, and only by developing increasingly effective ways of “augmenting human intellect” can we hope to remain abreast of the knowledge we need to use in the daily practice and management of healthcare.
Big data is a description of the datasets that are now available in many fields whose size and complexity put them beyond the power of conventional analytical methods. The term is often also used to include the techniques used in the analysis of these data (as in Forrester’s definition above). Three Vs characterize these datasets: volume, velocity and variety. As medicine moves from paper-based to electronic records, medical big data includes that entered by clinicians, as well as the output of medical devices (for example, ECGs, blood pressure monitors and imaging systems). Added to this are related records of process and workflow surrounding patient care, and financial and other information around the management of healthcare organizations.
Given all this, medical information cannot be so clearly demarcated as it has traditionally been. This era of power computing for the masses, with intuitive user interfaces connected to powerful handheld computing devices, has resulted in the explosion of unconventional sources of medical information, be it health apps, wearable and other smart technologies (Fitbit, Nike Fuelband), the generation of personal medical data, or access to genetic testing (23andMe). As the “internet of things” extends, smartphones are beginning to upload data from exercise machines in gymnasia, and it is easily conceivable that, for example, diet could be monitored through shoppers’ loyalty cards, air quality from weather reports and GPS-enabled mobile devices, or mental state from social network postings, allowing unprecedented studies of the impact of genes and environment on the development and progression of illness, or maintenance of health. Furthermore, it has become easy for patients to access medical information and self-diagnosis tools, resulting in the democratization of medical knowledge and the potential for patients to become highly informed about their conditions. “Crowdsourcing” organizations such as PatientsLikeMe allow people to compare their treatment with similar groups of patients and, along with other sites offering patient-held records, such as Healthvault, contribute their data to the scientific study of very large patient cohorts with similar conditions. The “bandwidth” of these data sources, as well as their unstandardized formats, are typical of the velocity, volume and variety of the big data world.
Big data analytics describes a fundamentally new way of analyzing information, predicated on the almost limitless storage and processing power of modern ICT. Analysis of information has traditionally been limited, explicitly or implicitly, by the processing power available. This has required the development of methodologies around sampling and matching groups to be compared, formulating hypotheses in advance in order to decide which variables to measure, and gathering data in structured formats. The advent of analytics engines turns this analysis on its head. In its simplest form, big data can be summarized as a move:
From some data to all data
Rather than selecting individuals, and individual variables to measure, the sample can expand to become the whole available population, and all of the information available on it. The variables no longer need to be predefined, and emerge as part of the analysis. The outputs can be surprising and illuminating, as in a recent case where a US hospital ran its clinical data through analytics to try to determine the causes of readmissions. To their surprise, they found that the patients’ mental state was a stronger predictor of readmission than any physical variable.
From clean data to messy data
Small samples in traditional statistical analysis require a great deal of attention to the quality of the data: complete, consistent, structured datasets that are highly predefined. With population-sized datasets, and analytical power sufficient to analyze extremely large numbers of factors, this is unnecessary. In addition, data no longer needs to be in structured formats: newspapers, social networks and e-mails all become potential sources of information that can be factored into the analysis.
From causality to correlation
Traditional statistical analysis requires the formation of a causal hypothesis that can be tested. Big data analytics does not require that, but neither is a causal hypothesis generated. Analytics merely generates a set of correlations, requiring interpretation. However, correlation is frequently all that is required, especially in medicine.
Big data in healthcare
“Big data offers the potential to create an observational evidence base for clinical questions that would otherwise not be possible” (5). Conventional analysis of clinical care is retrospective: we are all familiar with morbidity and mortality (M&M) meetings, reports on serious untoward incidents and the like. First, we look at what happened, and examine the process of care of individuals to look for improvements. Second, at an aggregated level, we apply statistical analysis to historical performance to develop an understanding of the factors affecting it. Third, we use more sophisticated levels of analysis to develop models to predict future performance. Big data analytics gives us the ability to combine these three processes. Using very large amounts of diverse information, causal and predictive modeling can be developed – even in highly complex environments such as medicine. At an individual level, particularly when combined with advances in genomics and universal genome sequencing, this promises an era of personalized medicine, where predictive, proactive and preventative medicine are the norm. It will be possible to predict from birth many of the illnesses to which people are predisposed, and to give advice on tailoring lifestyle or other measures to prevent or minimize the development of those illnesses. The implications for this are profound, and the world they presage is one where the practice of medicine is excitingly different. Whilst it is important to keep a clear view of the future prizes, the application of big data to medicine is in its infancy. Summarized below are the current examples of “state of the art” clinical analytics, and the benefits they can be expected to deliver.Practice improvement
The American Association of Ophthalmologists recently launched its IRIS national registry. Dubbed “ophthalmology’s moonshot”, it builds on the experience of the American Association of Cardiologists, which has been running similar registers for over 10 years. After its pilot phase, IRIS contained information from 370,000 patient visits, and the aim is for it to have 18 million patient visits by the end of 2015. It is focused on “total practice improvement at no extra cost.” Data is extracted from EPRs overnight, and the system can provide a real-time comparative and risk-adjusted portrayal of practice and outcomes. This is routinely provided through monthly reports, but physicians can query their own data at any time. Data can be sorted by individual, group (department), geographical area (up to national level), or by disease process. The system also provides evidence to support maintenance of professional registration, and compliance with national data-reporting standards. The experience of people using such systems is that they produce rapid and dramatic improvements in data quality, clinical processes and outcomes, and team functioning. The power of providing information on performance in (close to) real-time, and its impact on individual and team performance, was demonstrated by Deming and others, in transforming Japanese industry (and, later, US industry) after the Second World War. What they noted was the enthusiasm with which workers took hold of “their” data, and used it to transform their work. Early evidence is that the same excitement and impact can be seen in highly complex medical specialties. IRIS currently requires either direct links to an EPR system, or manual entry of data. The addition of the natural language-processing capabilities of systems, such as HPs Autonomy, would allow data to be extracted from letters, e-mail or other electronic communication, and possibly from telephone calls and conversations (a system using natural language processing attached to the Microsoft Lync teleconferencing facility is currently under development). The intelligent data operating layer (IDOL) in Autonomy is able to match such data with (for example) possible SNOMED terms, to create structured clinical information which can be confirmed by clinician or patient. In addition, this ability retrospectively to gather data from letters or other documents potentially unlocks data from archived records of pre-EPR cohorts of patients, which is of benefit to individual patients, whose timeline can be displayed in a consistent format, and for retrospective audit or research.Decision support
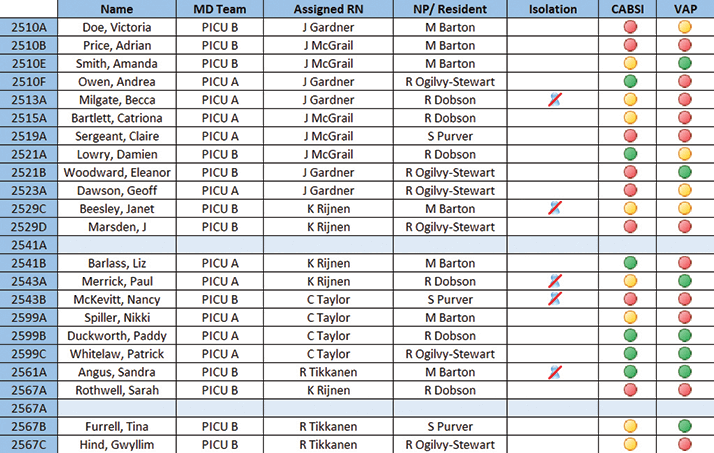
The simplest forms of decision support are those currently found in EPRs and prescribing systems, which can be configured to alert users of allergies, risks, or drug interactions. These require a source of clinical expertise, which is then coded into the electronic system. It is modifiable, but only by a further act of deleting or amending the original alert. The ability for analytics to come up with new, unsuspected and unexpected correlations and patterns allows the development of decision-support systems that build iteratively on past and ongoing experience. At Lucile Packard Children’s Hospital in Palo Alto, CA, USA (now rebranded as Stanford Children’s Health), the data from 40,000 pediatric patient records were used in the development of a system that could predict which children were likely to require intensive care. This was coupled with the development of an electronic whiteboard display (Figure 3), making it very simple to track progress. When it became fully operational in 2011, this system resulted in changes to care in around one-third of patient reviews. A similar system, automating a paper-based pediatric early-warning system, has recently been deployed in Kitakyushu Municipal Yahata Hospital in Japan, where, depending on its predictions, reviews of the patient change in frequency between every two hours and every eight hours. The system will be extended to adult patient cohorts, and, through web-based interfaces, provide patients’ relatives with online access to the system outputs.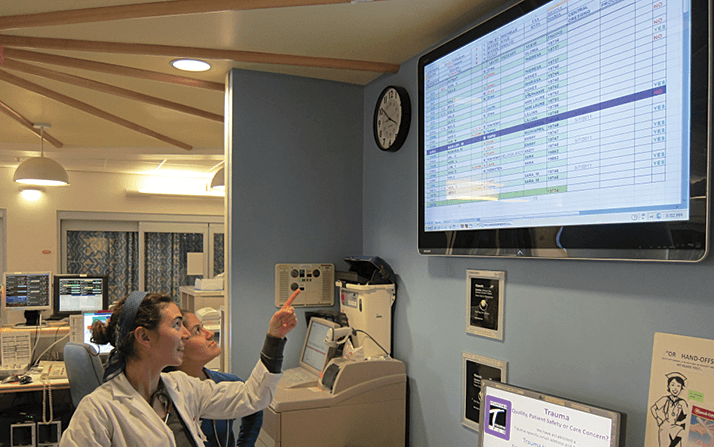
In Scotland, analytics is being used in risk stratification, to predict likelihood of hospitalization across a population of over 4 million people. Geisinger Health, in the US, is developing a system to predict heart failure in primary care. At the research level, one group has produced an AI system that significantly out-performed junior doctors in devising treatment strategies for chronic diseases in 500 mental health patients (6). The cost per unit change in health status (measured on a validated outcome scale), was reduced by 60 percent compared with “treatment as usual” and it was estimated that a 50 percent improvement in patient outcomes and a 50 percent reduction in cost per patient could be achieved using this system.
HP’s healthcare analytics system was also developed in collaboration with Stanford Children’s Health, and is based around the Autonomy analytics engine (7). Its IDOL product (Figure 4) is currently being introduced into multiple hospitals across the US. Although analytics can be used to derive structures from input data, it becomes even more powerful if given structures around which to work. Healthcare coding systems like SNOMED-CT and ICD-10 are sometimes viewed by clinicians as a necessary but tedious administrative slog. But the big data benefits of this structure are tangible and great, and this is why IDOL has been designed to work with such taxonomies. The major benefits are that IDOL can organize data and concepts around the standardized terms, which also serve as a uniform nomenclature system by which IDOL can communicate with other healthcare information systems.
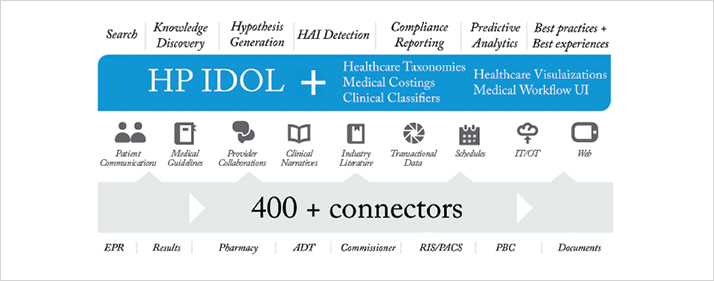
IDOL is fed by information from internal and external sources of data, using over 400 “connectors”, each of which is capable of understanding a particular format of data (for example, Microsoft Word or Excel documents, and images – each different file or image format needs its own connector. From this emerge the capabilities listed across the top of Figure 4). These include the ability to generate hypotheses, discover previously unsuspected correlations and links, and predict the course and outcome of illnesses and interventions. The ability to search and analyze almost all available data, in real-time, allows the system to reflect changing evidence and clinical practice. Clinicians using the system will be able to query the very latest evidence, including naturalistic outcomes from all patients allocated to a particular treatment. This is an effective way of accelerating “bench to bedside”, the time taken for interventions of proven efficacy to be adopted: clinical trials have an immediate impact on analytics-driven recommendations, which in turn increases the size of the patient cohort. At the level of the individual practitioner, such additional cases are “anecdotal”, but when aggregated they become part of a valuable dataset that can rapidly confirm or disconfirm effectiveness or provide evidence of rare complications, interactions or side effects.
Discovery and research
The US Institute of Medicine (IOM) is promoting the concept of the “learning health care system”, a place where “each patient-care experience naturally reflects the best available evidence, and, in turn, adds seamlessly to learning what works best in different circumstances.” The ability to track almost unlimited outcomes, treatments and environmental factors, either in real-time or retrospectively, and generate analysis of correlations between them opens up the possibility of accelerating the process of evaluation of treatments for their effectiveness. Big data approaches will transform the scale and timescale for clinical trials of both new and existing treatments. It is possible that prospective allocation to control or placebo groups will no longer be needed, as patients taking the new treatment can be matched against the total relevant population that is available to the analytics. However, there is also an integrative, divergent, holistic potential that is excluded by the careful selection and matching of subjects in conventional clinical trials. It is highly likely that current treatments for one condition may be found to be effective in the treatment or prevention of others – for example statins may prevent the development of both cataracts and age-related macular degeneration (8,9). Conversely, unexpected adverse effects, such as raised mortality rates, which may well not be reported as adverse events, may be highlighted by analytics.The best recent example of this was the discovery of increased death rates with COX-2 inhibitors. This initially emerged from a large Kaiser Permanente dataset. In retrospect, it is clear that had data from trials and health insurers (in the US) been subject to continuous analytics, these problems could have been detected much earlier. This is an example of how discoveries of new indications for current treatments, or unexpected side effects of treatments, which tend currently to be serendipitous, relying on chance observations by sharp-eyed clinicians, will emerge as unexpected correlations from the use of analytics. In addition, it will be possible to examine the relative effectiveness of combinations of treatments, evaluation of which would currently be either extremely expensive or logistically impossible. The ability to include unstructured and patient-generated data in research will open up investigation of environmental and social influences on disease formation or progression, and much more detailed study of the impact of treatments on patients’ quality of life.
Patient engagement
As interfaces between humans and machines become more sophisticated and intuitive, the potential to engage people in their own health and wellness becomes even greater. All of us have probably had the experience of patients coming to our clinics, and telling us what they think their diagnosis is, having researched it online. Apps have been developed which allow users to take pictures of their retinas using their smartphone, and send it to an ophthalmologist. There is no reason why decision-support systems cannot also be configured to help patients evaluate symptoms, and decide when to seek a consultation, and learn about their conditions and the choices available to them for treatment.Practical actions
Across medicine in the developed world there are growing numbers of big data analytics systems making significant impacts on patient care and clinician experience at the front line. Making this work across large swathes of medicine is no longer a question of research, but of implementation. This is a complex field, and only by IT companies working in close partnership with healthcare organizations can we make really effective use of the information we all gather in our clinical work, and thereby produce a dramatic acceleration in the rate of progress of medicine across all disciplines. However, analytics is a pinnacle of modern medicine, and there are foundations that need to be in place first:- For analytics to be effective, data needs to be collected in electronic format: ophthalmologists should make every effort to use EPR systems for recording data.
- Data is entered by patients and other non-professionals, too. We should encourage patients, relatives, and the general public to collect and share information relevant to their ophthalmic health. And we should engage with Healthvault, PatientsLikeMe, etc.
- Integrated data can give insights that isolated specialty data cannot: ophthalmology data should, where possible, be entered as part of an EPR shared across all specialties, or integrated with such an EPR. Beyond this, there are huge potential advantages to having wider health system data integration, including data from opticians and optometrists.
- Every clinical encounter can be an opportunity for improvement, research and better patient experience. We need to create opportunities/ plans/ systems that provide real-time decision support, including suggestions for enrolment to clinical trials.
- The bigger the dataset, the more power it has. European ophthalmologists should consider participating in the IRIS project, benchmarking and learning with a very large cohort of peers. Alternatively, we should ask, where is the EU's IRIS?
Pete Sudbury is a Consultant Psychiatrist and former Medical Director in the NHS and a Healthcare Specialist with HP Enterprise Services, Bracknell, UK.
References
- D.C. Engelbart. Augmenting Human Intellect: a conceptual framework, (1962) .
- E.C. Hayden, “Is the $1,000 genome for real?” Nature News (2014) doi:10.1038/nature.2014.14530.
- G.E. Moore, “Cramming more components onto integrated circuits”, Electronics, 38, 114–117 (1965).
- For more information on singularity, see www.33rdSquare.com.
- T.B. Murdoch, A.S. Detsky, “The inevitable application of Big Data to health care”, JAMA, 309, 1351–1352 (2013). doi: 10.1001/jama.2013.393.
- C.C. Bennet, K. Hauser, “Artificial intelligence framework for simulating clinical decision-making: A Markov decision process approach”, Artif. Intell. Med., 9–19 (2013). doi:10.1016/j.artmed.2012.12.003.
- HP Healthcare Analytics.
- D.T.Q. Barbosa, T.S. Mendes, H.R. Cíntron-Colon, et al., “Age-related macular degeneration and protective effect of HMG Co-A reductase inhibitors (statins): results from the National Health and Nutrition Examination Survey 2005–2008”, Eye (2014). Epub ahead of print, doi:10.1038/eye.2014.8.
- J. Kostis, J.M. Dobrzynski, “Statins prevent cataracts: a meta-analysis”, Eur. Heart J., 34 (Abstract Supplement), 163 (2013). doi:10.1111/jsm.12521.